Blender EEVEE on an 8 GB laptop GPU: measured render times and VRAM by resolution, samples, and scene size
On a laptop with an RTX 4070 Laptop GPU (8 GB), we rendered three scenes with Blender 5.2.1 EEVEE while changing resolution, sample count, raytracing, and shadows, and measured the time per frame and graphics memory use. The post also explains how we measured and how to run the same test on your own PC.
한국어English
ON THIS PAGE
- 011. The short answer
- 022. Test setup
- 033. The three test scenes
- 044. How we measured
- 055. Time by resolution
- 066. Time and quality by sample count
- 077. Raytracing and shadows
- 088. All results at a glance
- 099. Why the first frame takes long
- 1010. Measuring graphics memory (VRAM) and the results
- 1111. Temperature and clock speed
- 1212. Running the same test on your PC
- 1313. Cutting render time, in order
- 1414. Common mistakes and fixes
- 1515. In one line
- 16References
Based on: Blender 5.2 LTS (measured with 5.2.1, EEVEE) and an NVIDIA GeForce RTX 4070 Laptop GPU with 8 GB (driver 610.62). Measured on my PC on November 1, 2026. Images are real renders and Blender screenshots. The chart is drawn from the measured values.
How far can you comfortably go with Blender EEVEE on a laptop with 8 GB of graphics memory (VRAM)? A spec sheet will not tell you. So we measured it. On one laptop we built three scenes and changed resolution, sample count, raytracing, and shadows one at a time, timing how many seconds one frame takes. We also logged how full the graphics memory got.
How EEVEE and Cycles differ is covered in Fast EEVEE, accurate Cycles, and what settings like resolution and samples mean is in Blender render settings basics. This post is the "numbers" companion to those two. It explains the test setup and method, the results for each condition, how to read them, and how to run the same test on your own PC.
1. The short answer
| Question | What I measured on my PC |
|---|---|
| One frame at 1920x1080, 64 samples | 0.53 to 0.82 s |
| A 10-second video at the same settings (24 fps, 240 frames) | about 2 min 7 s to 3 min 17 s |
| Going up to 3840x2160 (4K) | 2.4 to 2.9 times slower than 1080p |
| Raising samples from 16 to 256 | 4.6 to 6.2 times slower, with almost no visible difference in these scenes |
| Turning raytracing on | 1.5 to 1.6 times slower, but reflections on the metal ball change a lot |
| Turning shadows off | 29 to 38% faster |
| Graphics memory | Whole-GPU use peaked at 3.0 to 3.5 GB, less than half of 8 GB |
| The first frame | Up to 15 to 23 s for the first frame after starting the program |
In short, scenes of this size were easy to handle with EEVEE on an 8 GB laptop. Resolution and sample count changed the time the most. Scene size (the number of objects) mattered less than we expected.
2. Test setup
To compare results with another PC, you first need to match the conditions. Here is what we used.
| Item | Value |
|---|---|
| Laptop | Acer Predator PHN16-72 |
| GPU | NVIDIA GeForce RTX 4070 Laptop GPU, 8 GB (8188 MiB) |
| Graphics driver | 610.62 |
| CPU | Intel Core i9-14900HX |
| RAM | 32 GB |
| Operating system | Windows 11 Pro |
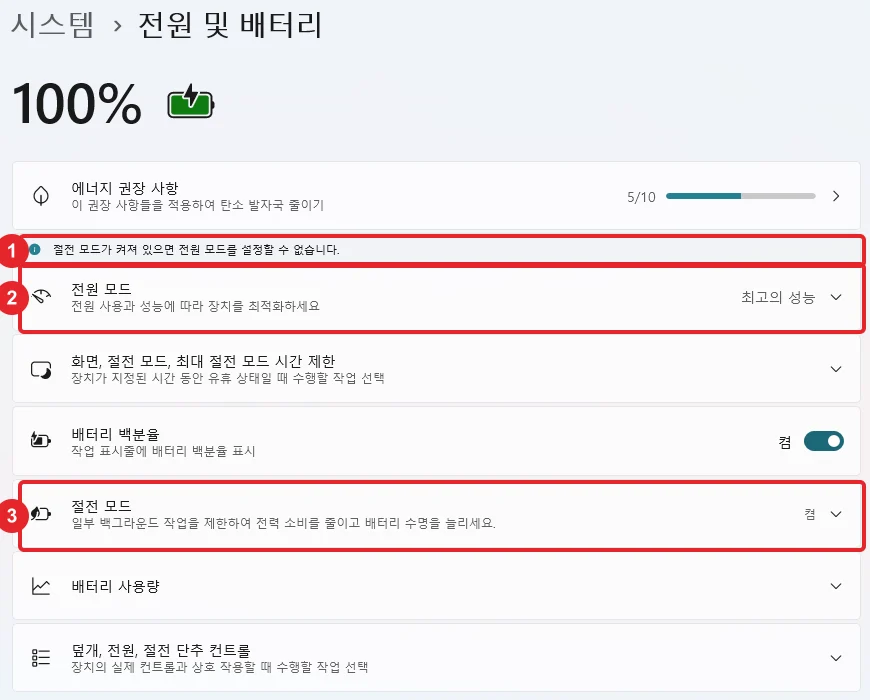
| Power | Adapter plugged in (battery at 100%), Windows power mode "Best performance". However, Windows Energy Saver was on, so the GPU may actually have run in the efficiency mode (checked 2026-11-02; see How laptop energy saver affects render times) |
| Blender | 5.2.1 LTS, EEVEE render engine |
| How it ran | Without a window (background mode), a fresh Blender for each scene |
This laptop also draws the screen with the same GPU, and a few other programs were open during the test. So these are "everyday" values, not clean lab values. On laptops, the same parts can perform very differently depending on power mode and cooling. That is covered in Laptop vs desktop for Blender and 3D work.
3. The three test scenes
We built three scenes of different sizes with a script, so the scene contents stayed exactly the same every time we changed a condition.
 Figure 1. From left: the small, medium, and large scenes. All rendered at 1920x1080 with 64 samples (Blender render)
| Scene | Contents | Objects | Triangles |
|---|---|---|---|
| Small | A smoothed monkey head (Suzanne), a box, a metal ball, a floor | 4 | about 17,000 |
| Medium | About 300 trees, 80 rocks, 6 houses, a floor (each a separate object) | 383 | about 15,000 |
| Large | One tree scattered over the floor with geometry nodes | 1 floor + 43,200 tree instances | about 1.99 million |
Object counts include the floor. The chart legend in Figure 5 lists the small scene as "3 props" (three props, not counting the floor).
An instance places the same object many times by only "pointing" to it, a bit like stamping the same stamp over and over. The shape is stored once and only the positions differ, so it uses less memory. The large scene has over 40,000 instances and close to 2 million triangles. The Blender 5.2 release page says EEVEE got faster in scenes with many instances. That change is covered in Blender 5.2 LTS hands-on.
4. How we measured
Render times wobble a little even under the same conditions, so we did not measure just once.
- Start a fresh Blender for each scene and record the time of the very first render separately.
- After changing a condition (resolution, samples, and so on), render one frame and throw it away. This keeps setup time for the new settings out of the result.
- Render 10 frames under the same condition and take the average. Do this three times.
- Use the middle value (median) of the three averages as the result.
- Time only the render, not saving the image to a file.
At first we measured each condition with just three single frames. The values for the same condition scattered from 0.5 s to 4.4 s. Each frame took under a second, so even a short burst of GPU use by another program shook the result. Once we averaged batches of 10, the three values mostly landed within 20% of each other. When you measure, do not judge from a single frame.
The base settings are 1920x1080 (100%), 64 render samples, raytracing off, and shadows on. You change these in the Render tab.
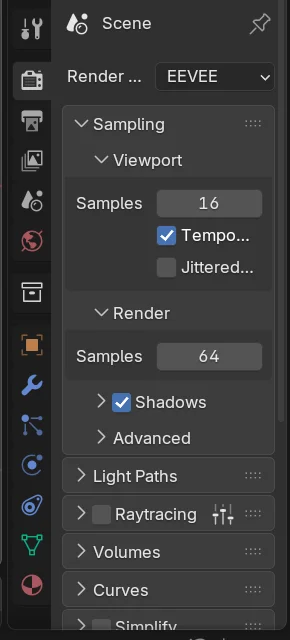 Figure 2. The base settings in the Render tab. From the top: Render Engine is EEVEE, Sampling > Render > Samples is 64, Shadows is on, Raytracing is off (Blender screenshot)
Follow along: In the Properties editor, click the Render tab (the camera-back icon). Under Sampling, enter 64 in Samples below Render. Leave the checkbox next to the Raytracing title off. Set the resolution in Resolution X and Y on the Output tab.
5. Time by resolution
We kept 64 samples and changed only the resolution. Values are seconds per frame.
| Resolution | Small | Medium | Large |
|---|---|---|---|
| 960x540 | 0.33 | 0.29 | 0.55 |
| 1920x1080 | 0.56 | 0.53 | 0.82 |
| 3840x2160 | 1.41 | 1.56 | 1.98 |
Going from 1920x1080 to 3840x2160 gives four times as many pixels. The time grew 2.4 to 2.9 times, not 4 times. Dropping to 960x540 gives a quarter of the pixels, but the time only fell to 55 to 67%. Some setup time is spent no matter the resolution, and it looks bigger at small sizes.
Thinking in video helps. A 10-second video at 24 fps is 240 frames.
| 10-second video (240 frames) | Small | Medium | Large |
|---|---|---|---|
| 1920x1080 | about 2 min 14 s | about 2 min 7 s | about 3 min 17 s |
| 3840x2160 | about 5 min 38 s | about 6 min 14 s | about 7 min 55 s |
These add up render time only. In practice, saving the image files adds more. The habit that saves the most time is checking at 960x540 first and rendering large only once you like it.
6. Time and quality by sample count
Samples set how many slightly different passes of the scene are drawn and blended into one frame. It is like stacking several photos to reduce noise. More samples give smoother edges but take longer.
| Samples (1920x1080) | Small | Medium | Large |
|---|---|---|---|
| 16 | 0.31 | 0.36 | 0.41 |
| 64 | 0.56 | 0.53 | 0.82 |
| 256 | 1.60 | 1.67 | 2.56 |
Going from 16 to 256 samples, 16 times more, made renders 4.6 to 6.2 times slower. But the quality difference was smaller than expected.
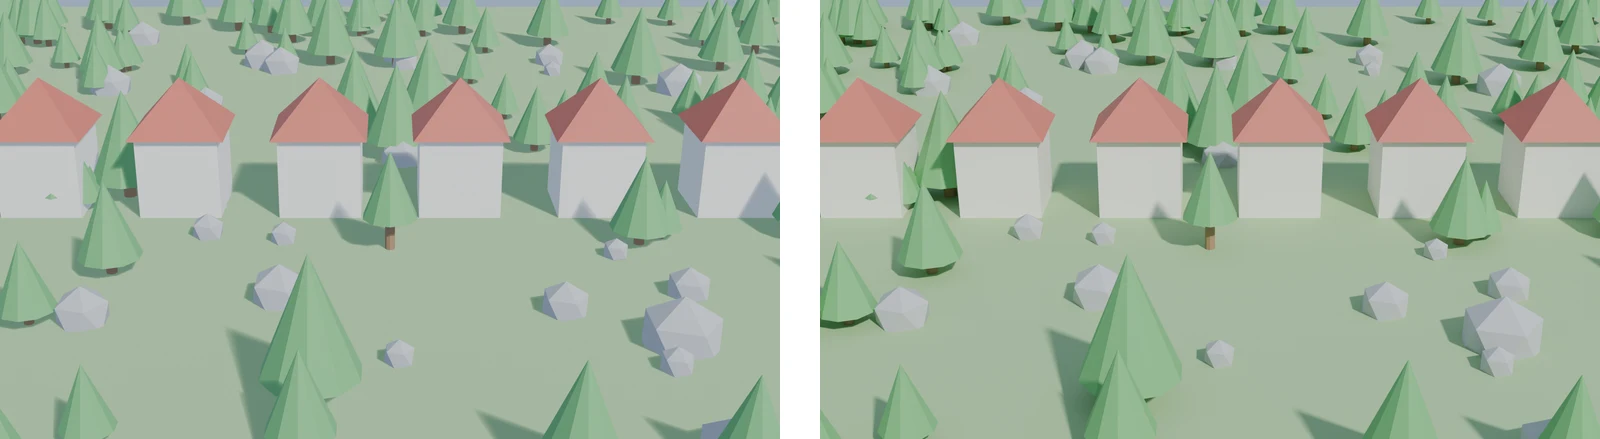
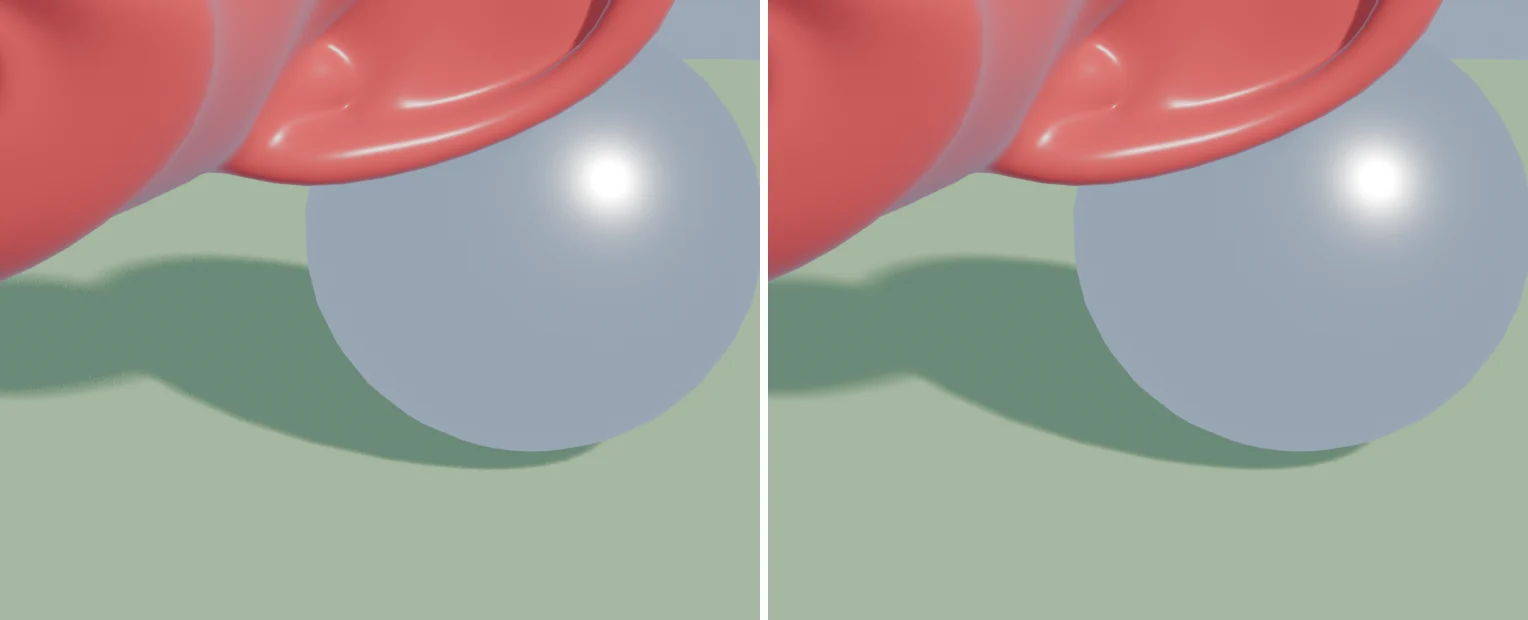 Figure 3. The same area zoomed in. Left: 16 samples (0.31 s). Right: 256 samples (1.60 s). Only the edge of the floor shadow is slightly smoother (Blender render)
How to read it: Compare the ends of the shadows on the floor. The right one is a bit smoother, but unless you zoom in they look almost the same. These scenes have one sun and simple materials, so even few samples came out clean. Effects that eat samples, such as hair, blurred backgrounds (depth of field), and motion blur, make the difference bigger. For your scene, render one frame each at 16, 64, and 256 and compare before you decide.
7. Raytracing and shadows
| Setting (1920x1080, 64 samples) | Small | Medium | Large |
|---|---|---|---|
| Base (raytracing off, shadows on) | 0.56 | 0.53 | 0.82 |
| Raytracing on | 0.82 | 0.87 | 1.25 |
| Shadows off | 0.35 | 0.36 | 0.58 |
Raytracing follows the paths of light bouncing off objects to draw reflections and indirect light more believably. In EEVEE you turn it on with the Raytracing box in the Render tab. With it on, renders were 1.5 to 1.6 times slower. In return, shiny objects changed a lot.
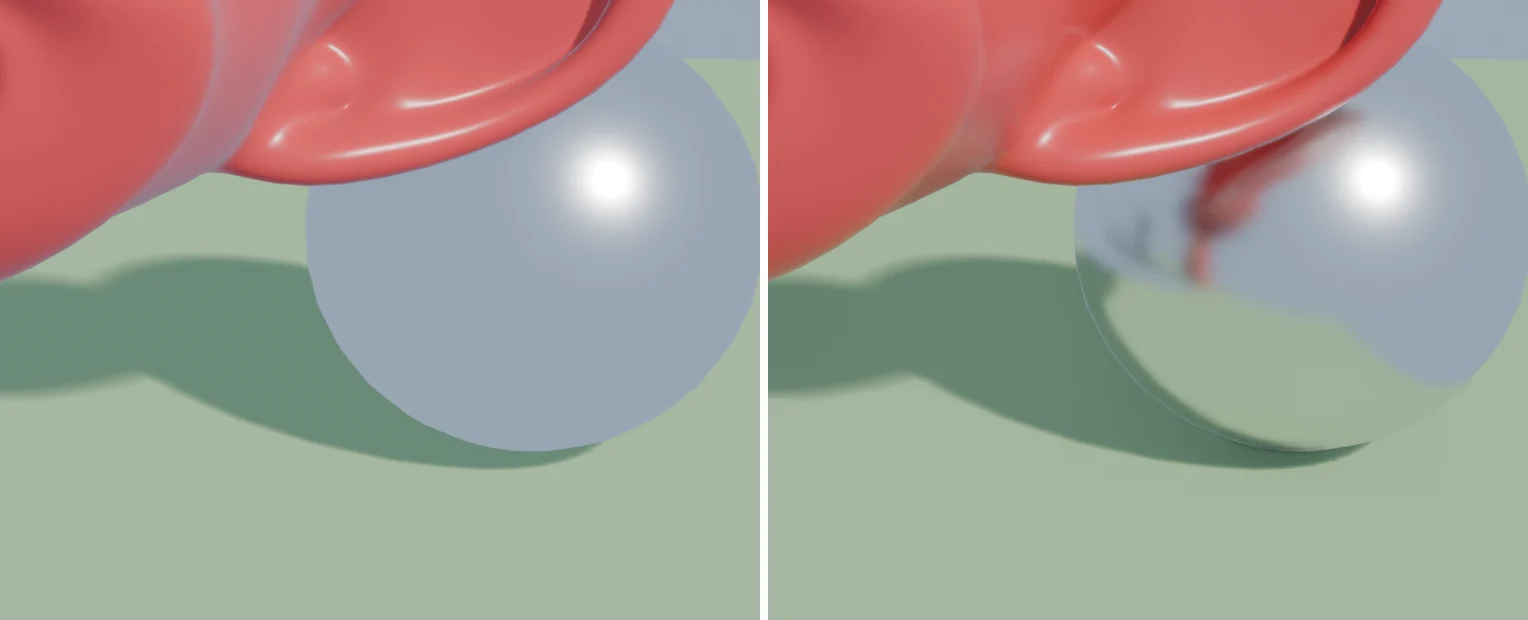 Figure 4. Left: raytracing off (0.56 s). Right: raytracing on (0.82 s). With it on, the monkey head and floor reflect on the metal ball (Blender render)
How to read it: The ball on the left is just an even bluish gray. On the right, the red monkey head and green floor show like in a mirror. If your scene needs surroundings to reflect, as with metal, glass, or water, about 0.3 s more is worth it. If there is nothing to reflect, leave it off.
Turning shadows off made renders 29 to 38% faster. But objects look like they float above the floor, so it is rarely off in a final render. Use it briefly when you only want a quick look at the motion. Volume effects such as fog were not measured this time.
8. All results at a glance
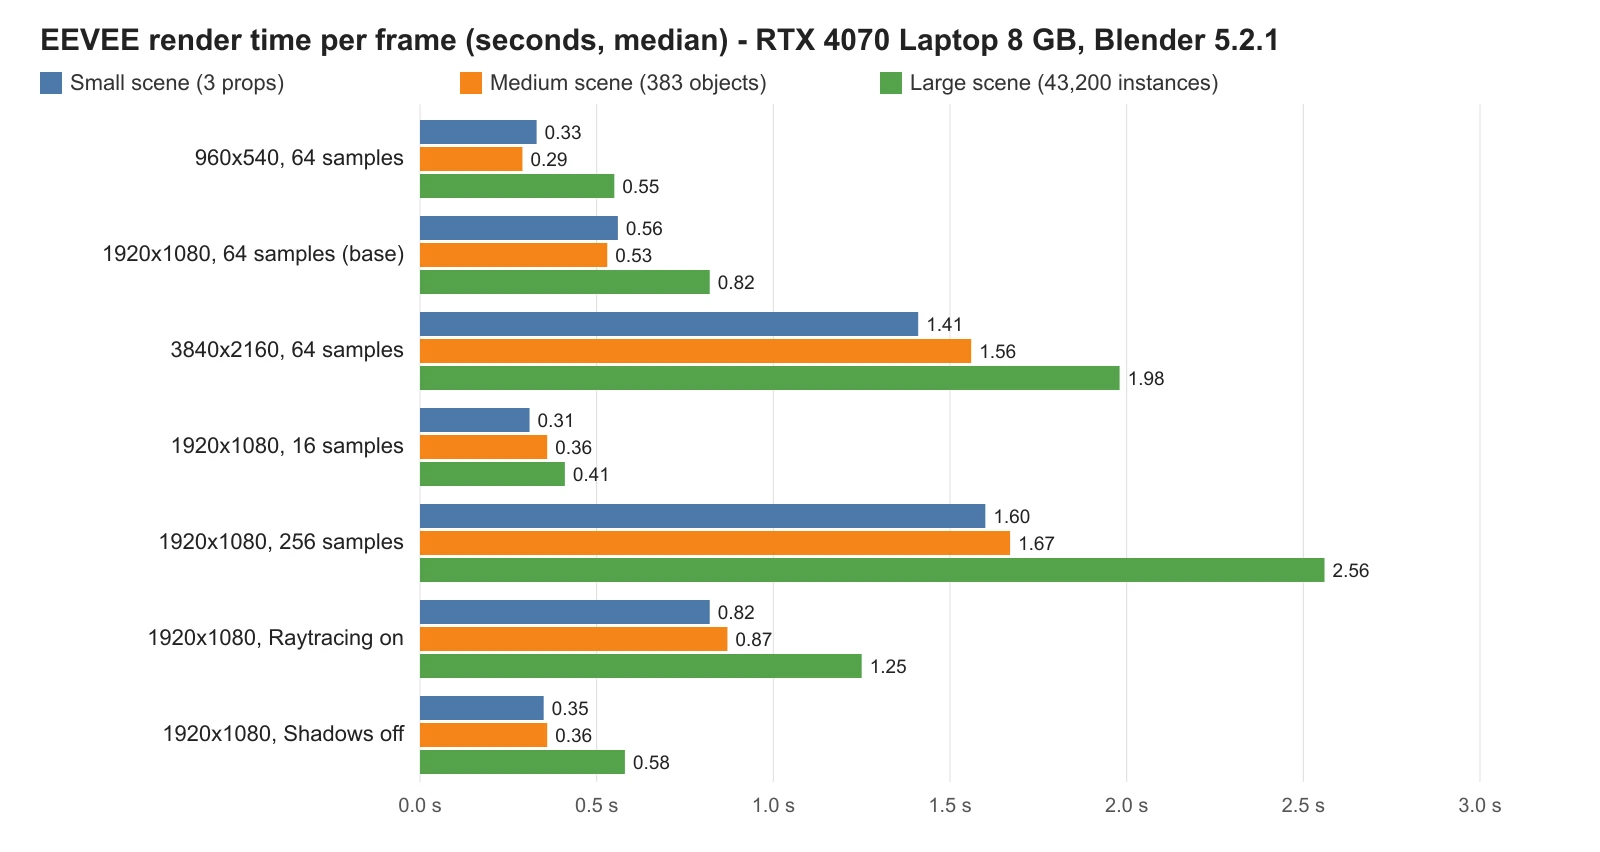 Figure 5. Render time per frame by condition (seconds, median). Blue is the small scene, orange the medium scene, green the large scene (chart)
How to read it: Longer bars mean longer renders. The 4K and 256-sample bars stand out. Within each row, the green (large scene) bar is always the longest, but its gap to blue and orange is smaller than the gap between conditions. Choosing resolution and samples affects time more than cutting objects does.
9. Why the first frame takes long
We timed the first render separately after starting a fresh Blender for each scene.
| First render | Small | Medium | Large |
|---|---|---|---|
| First run (before shader preparation) | 22.1 s | 23.4 s | 14.6 s |
| Running the same test again | 3.3 s | 3.5 s | 9.5 s |
From the second frame on it was under a second, but the first frame took long. EEVEE first turns materials into small programs the GPU reads (shaders). Most of the long first frame looks like this preparation time. The much shorter first frame on the second run also looks like it reused what was prepared the first time. Do not cancel a render right away thinking it has frozen. Waiting for the first frame is normal.
10. Measuring graphics memory (VRAM) and the results
VRAM is the dedicated memory on the graphics card. Think of it as the size of a workbench: the scene's shapes, textures, and in-between render results sit on it while the card works. More on this in What VRAM means.
With an NVIDIA card, nvidia-smi, which installs with the driver, can log memory use. Before starting a render, open Command Prompt and enter the command below. It appends one line of usage to a file every 0.25 seconds.
nvidia-smi --query-gpu=timestamp,memory.used,utilization.gpu,temperature.gpu --format=csv,noheader -lms 250 > vram_log.csv
When the render ends, press Ctrl+C to stop it and find the largest memory.used value in the file.
| Scene | Before start | Peak |
|---|---|---|
| Small | 0.6 GB | 3.0 GB |
| Medium | 0.6 GB | 3.0 GB |
| Large | 1.7 GB | 3.5 GB |
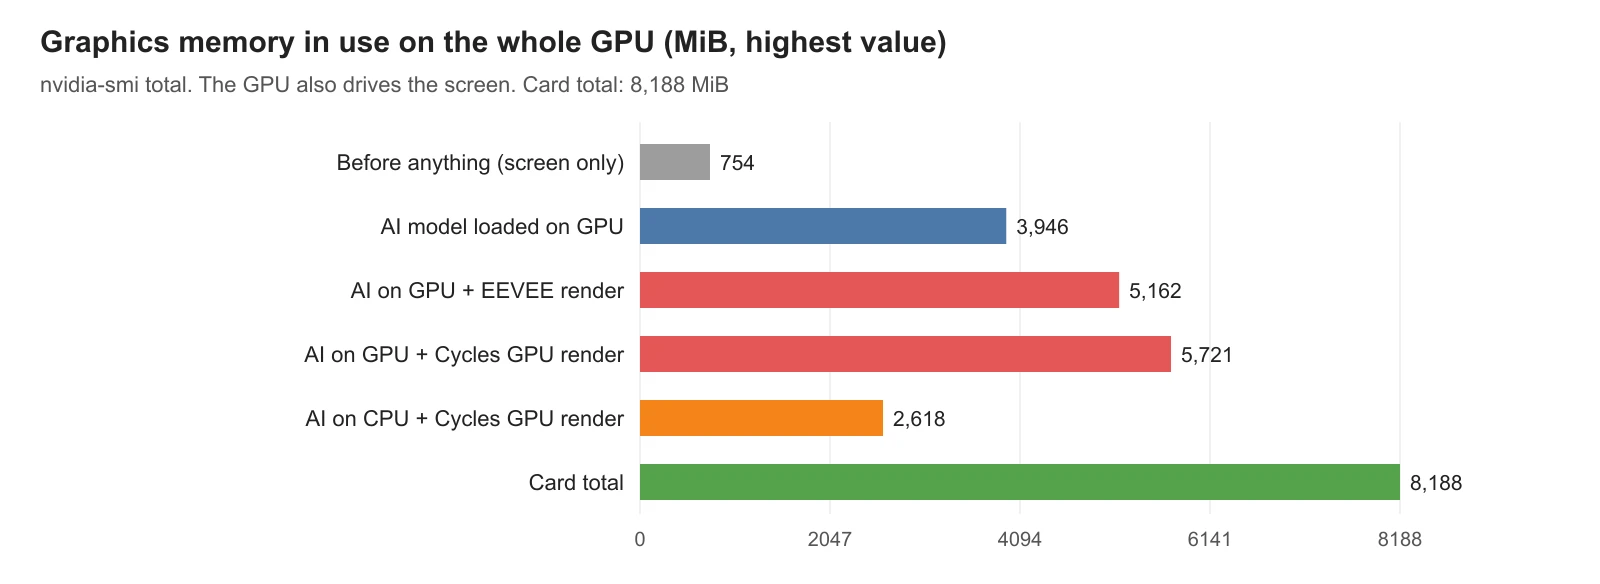
These numbers are for the whole GPU, not Blender alone. They include the screen and other programs. On Windows this command does not show per-program use, so we recorded the total. Subtracting the before-start value, Blender added roughly 1.8 to 2.4 GB. The large scene's before-start value (1.7 GB) was higher than the other two because of memory other programs were using.
No scene went past half of 8 GB. So in this test we did not see what happens when memory runs out. Many large textures or a much higher resolution will raise usage. If you want to know whether your scene gets close to 8 GB, measuring it with the command above is the most accurate way.
There is also a reason we did not list memory per condition. Memory taken once did not shrink right away after changing conditions, so each condition's value was affected by the one before.
11. Temperature and clock speed
In the same log, the GPU temperature peaked at 91 to 93 °C. The GPU's working speed (clock) also dropped sharply at moments from its maximum of 2520 MHz. Laptops slow themselves down when they get hot. This is called throttling. The longer the video, the more the later frames may slow a little. How it works is in Thermal throttling. For long renders, keep air flowing under the laptop and keep the power adapter plugged in.
12. Running the same test on your PC
The script below times the open scene the same way (throw away one frame, then three batches of 10) and prints the result. It does not save files, so it will not change your scene.
Starting state: Open the .blend file you want to measure in Blender. Keep the render engine on EEVEE.
Follow along:
- Click Scripting in the workspace tabs at the top.
- In the Text Editor, click New.
- Paste the code below.
- Press
Alt+Por click the ▶ button to run it. - Open Window > Toggle System Console to see the result.
import bpy, time, statistics

def one():
    t = time.perf_counter()
    bpy.ops.render.render(write_still=False)
    return time.perf_counter() - t

print("first render:", round(one(), 2), "s")
one()  # throw one away
avgs = [sum(one() for _ in range(10)) / 10 for _ in range(3)]
print("per frame (median):", round(statistics.median(avgs), 2), "s", [round(a, 2) for a in avgs])
Blender looks frozen while it runs. It moves again once all 31 frames are done. Run it several times while changing resolution and samples to build a table for your own scene. Measuring with the window open mixes in screen drawing, so values may come out a little slower than the background-mode values in this post.
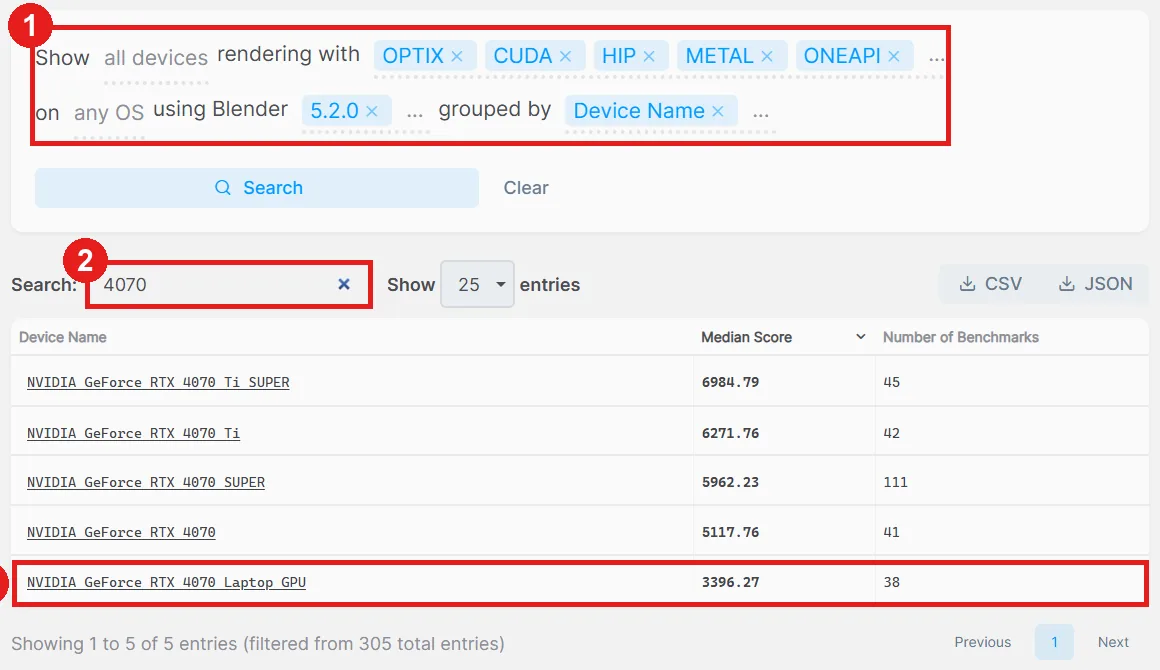
To compare with other GPUs, see Blender's official benchmark site, Blender Open Data. Its scores are measured with Cycles, though, so they cannot be compared directly with the EEVEE times in this post.
13. Cutting render time, in order
Based on the results, here are the steps with the biggest effect first.
- Render test frames at 960x540. Lowering the resolution percentage (%) on the Output tab to 50% gives a quick look without changing your 1920x1080 settings.
- Pick samples by rendering one frame each at 16, 64, and 256. If you see no difference, use the lower one.
- Turn raytracing on only for scenes that need reflections.
- Wait for the first frame. It gets faster after the preparation.
- Think about cutting objects last. In this test, even the 40,000-instance scene took under a second per 1080p frame (for these scenes with few textures).
14. Common mistakes and fixes
| Symptom | Cause | Fix |
|---|---|---|
| Nothing happens for tens of seconds after starting a render | Shader preparation for the first frame | Wait. It speeds up from the second frame |
| The time differs every run with the same settings | Another program shares the GPU, or only one frame was measured | Close other programs and look at the average of many frames |
| The later part of a long video renders slower and slower | Heat lowers the GPU speed | Plug in the adapter, keep the bottom ventilated, check the power mode |
| Rendering on battery is much slower | Power is limited on battery | Plug in the adapter before rendering |
| Raising samples a lot changes nothing visible | The scene is simple enough for few samples | Lower the samples and save time |
| Metal comes out a flat bluish gray | Raytracing is off | Turn on Raytracing in the Render tab |
15. In one line
EEVEE on an 8 GB laptop: under a second per 1080p frame, less than half the memory used, and render time set by resolution and samples. For choosing a GPU, continue with Choosing a graphics card for Blender rendering and Computer specs for AI, Blender, and game engines.
References
- Blender 5.2 LTS manual: EEVEE render settings
- Blender 5.2 release page
- Blender Open Data
- Images: the renders and Blender screenshots are our own. The chart is drawn from the measured values.