How to read Blender Open Data benchmark results: find and compare your graphics card
Pick a Blender version and device filters on Blender's official benchmark site Open Data, find your graphics card's score, learn what the score means (samples Cycles renders per minute), how to read the median and the number of results, and what to watch when comparing laptop chips.
한국어English
Based on: the Blender Open Data site (opendata.blender.org) and its About page, Blender 5.2.0 results. Checked in November 2026. The pictures are real screenshots of the Open Data site and of the Blender 5.2.1 Preferences. The red numbers and boxes were added to explain them. Scores on the site change a little as new results come in.
When you buy a graphics card or choose a laptop, you want to know how fast it is in Blender. Reviews use different scenes and settings, so their numbers are hard to compare. Open Data, run by the Blender Foundation, is the official benchmark site that collects results measured by users around the world with the same scenes and the same method. Think of it as a pile of report cards from people who all took the same test.
This guide explains how to find your graphics card's score on Open Data, what the score means, and what to watch when comparing laptop chips.
1. The Open Data home page
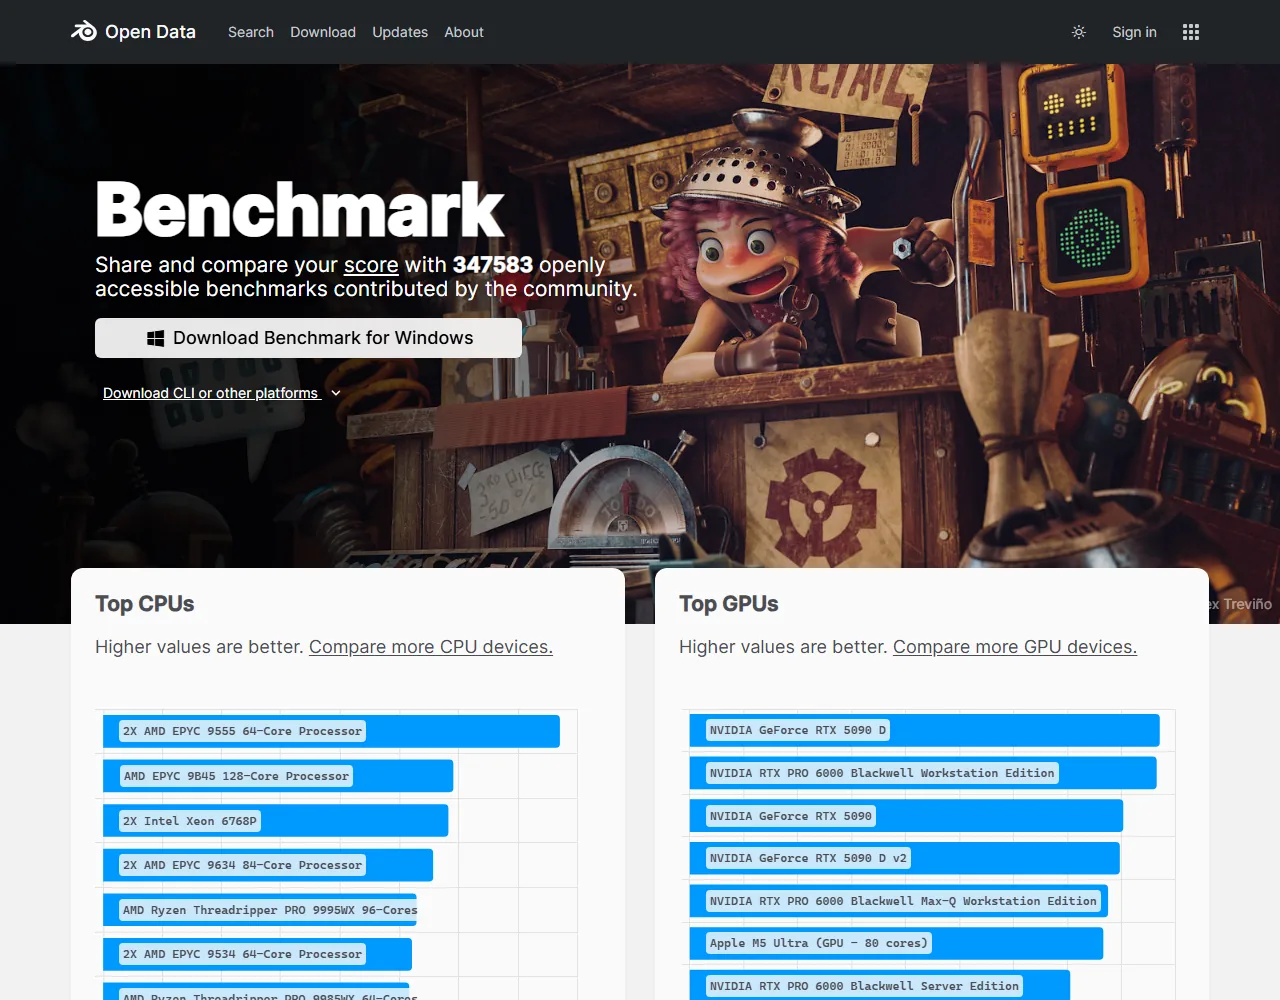 Figure 1. The Open Data home page. The number of results collected is at the top, and the top CPU and GPU lists are below (opendata.blender.org screenshot)
The home page shows how many results have been collected (347,583 when checked) and bars for Top CPUs and Top GPUs. Click a link such as "Compare more GPU devices." above a list to open the search screen with filters.
2. What the score means
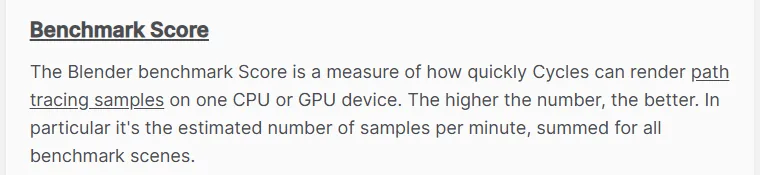 Figure 2. The score explanation on the About page (opendata.blender.org screenshot)
The score measures how quickly Cycles can render path tracing samples on one CPU or GPU device, and more exactly it is the estimated number of samples per minute, summed for all benchmark scenes. Higher is faster.
Cycles is Blender's render engine that follows the paths of light bouncing between objects, one by one, to make a picture. A sample is one such light path worked out. More samples mean less grainy noise in the picture. So if one score is twice another, rendering the same scene with the same samples should take roughly half the time.
3. Find your graphics card with filters
Steps:
- On the home page, click Compare more GPU devices. above Top GPUs.
- Read the filter sentence at the top (① in Figure 3). After "rendering with" are OPTIX, CUDA, HIP, METAL and ONEAPI. After "using Blender" is the version (5.2.0), and after "grouped by" is Device Name. To change the version, click the version field, pick one and click Search.
- Type part of your graphics card name in the Search box above the table (② in Figure 3). Example:
4070. - Find your device row in the table (③ in Figure 3).
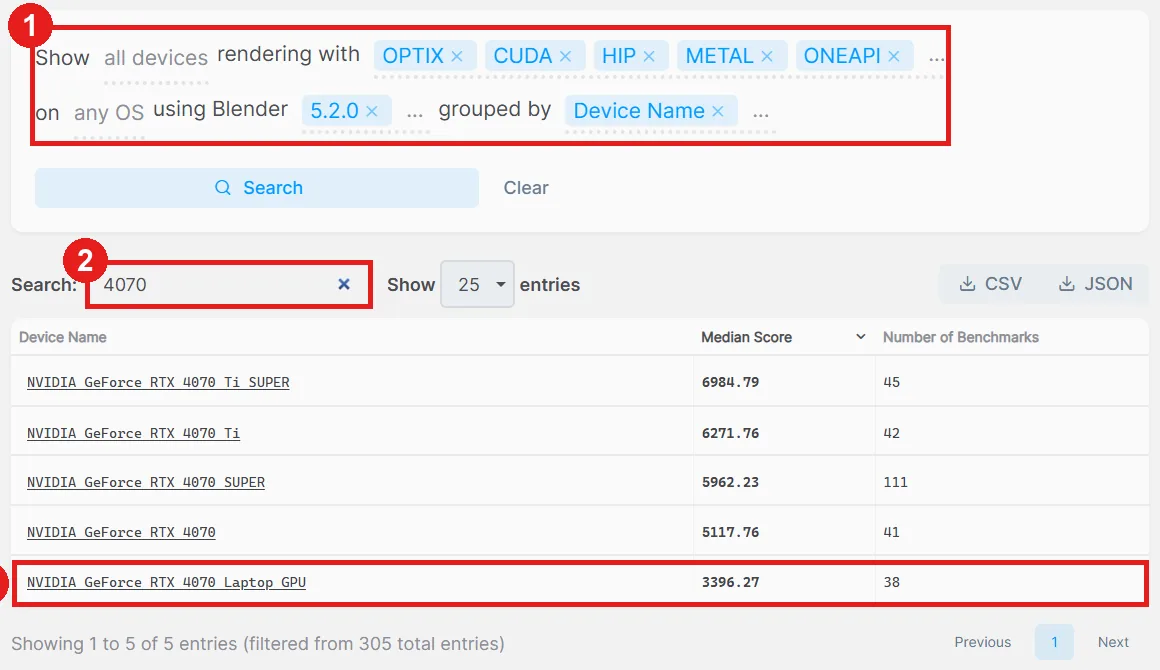 Figure 3. Results for 4070. ① Filter sentence ② Search box ③ RTX 4070 Laptop GPU row (opendata.blender.org screenshot)
Names such as OPTIX and CUDA in the filter sentence are ways of handing the work to the graphics card. NVIDIA uses CUDA and OptiX, AMD uses HIP, Intel uses oneAPI and Apple uses Metal. OptiX uses the card's hardware ray-tracing acceleration.
Checking which method and device your Blender uses first makes it easier to pick the same filters on Open Data.
Steps: Open Edit > Preferences and click System in the list on the left. At the top, under Cycles Render Devices, see which tab is pressed (CUDA, OptiX and so on) and which device is checked. You only need to look; you do not have to change anything.
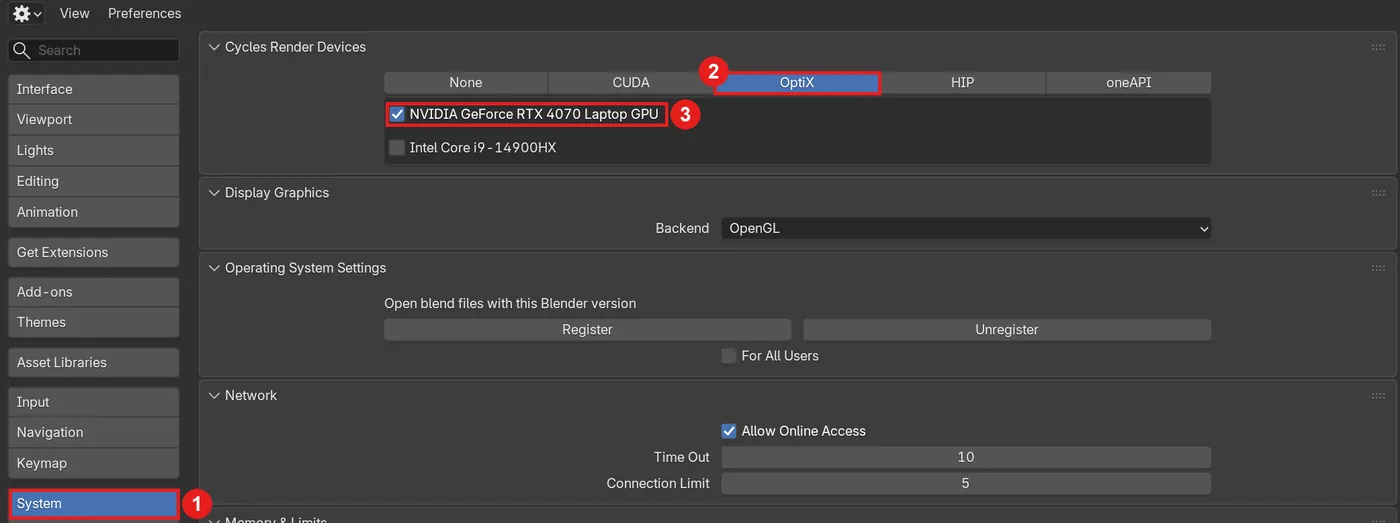 Figure 4. Cycles Render Devices in Preferences. ① System ② OptiX tab pressed ③ Checked device (Blender screenshot)
With the screen in Figure 4, you would look for OPTIX and "NVIDIA GeForce RTX 4070 Laptop GPU" on Open Data.
Read the two numbers in the table like this.
| Column | Meaning | How to read it |
|---|---|---|
| Median Score | The middle value when all results for that device are sorted | Less affected by one or two odd results |
| Number of Benchmarks | How many results were uploaded for that device | Be careful when the number is small |
For example, in Figure 3 the RTX 4070 Laptop GPU has a median of 3,396 from 38 results. The desktop RTX 4070 scores 5,118 even though both are called 4070, about 1.5 times the laptop chip.
4. Compare laptop chips
Steps:
- Clear the Search box and type
Laptop GPU. - Use the page numbers below the table to see the next page. There were 43 rows on two pages when checked.
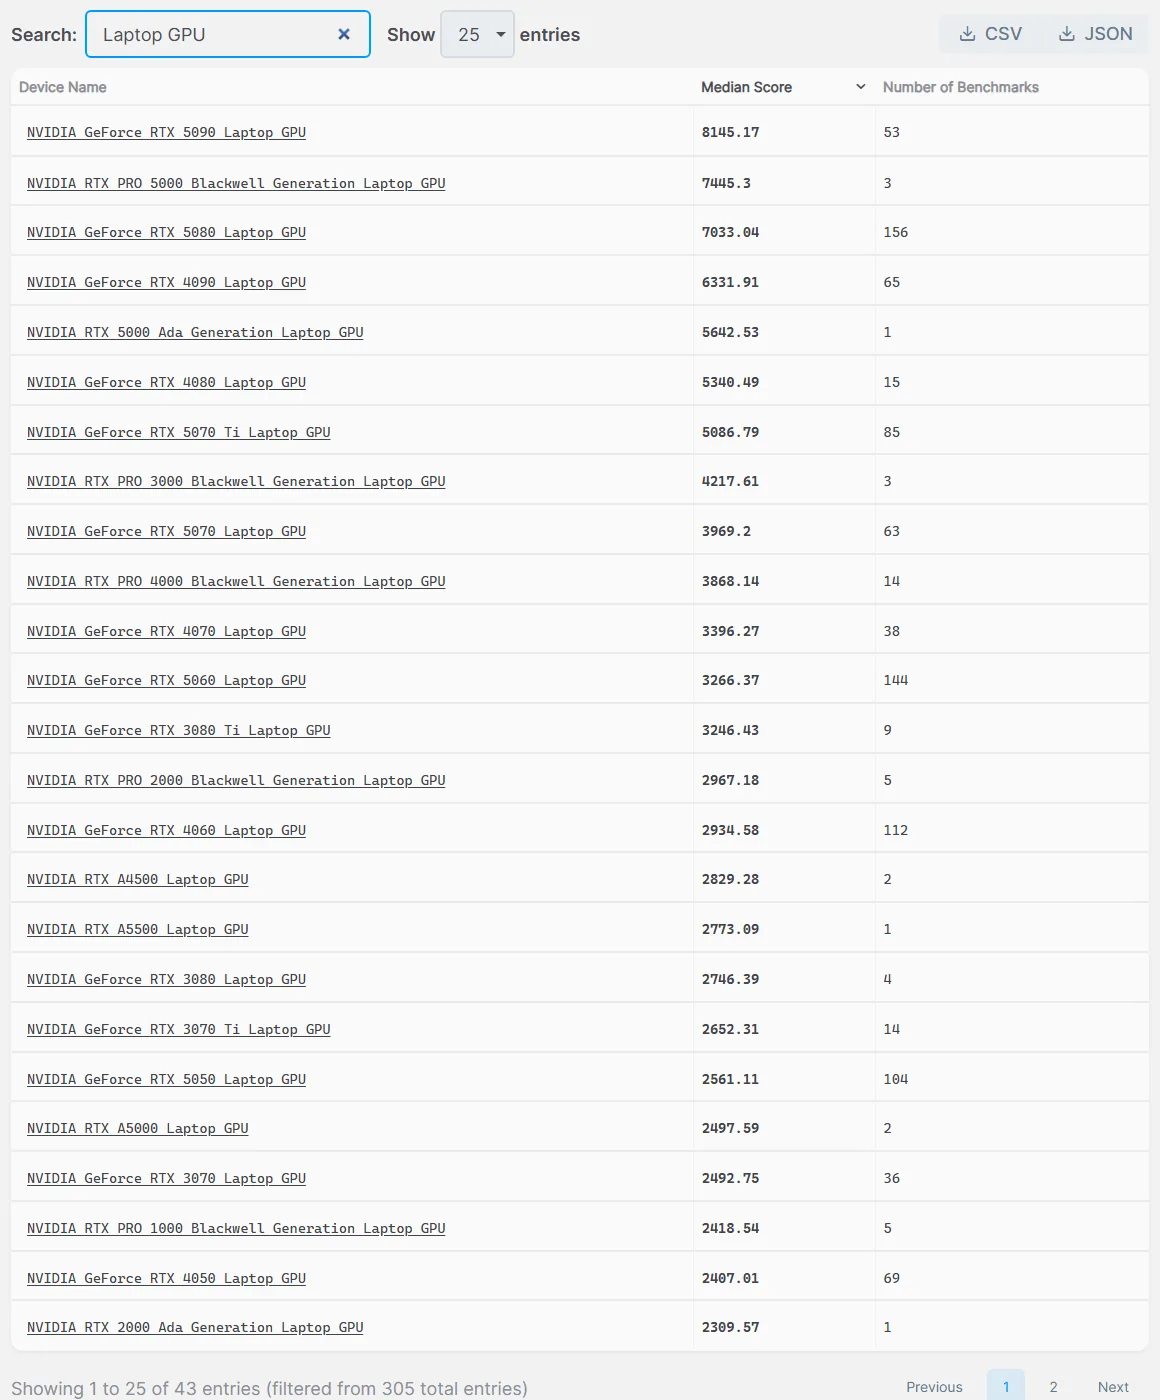 Figure 5. First page of results for Laptop GPU (opendata.blender.org screenshot)
Picking only the GeForce RTX 30, 40 and 50 series laptop chips from both pages and sorting them by score gives this table (Blender 5.2.0, values when checked).
| Laptop chip | Median score | Results |
|---|---|---|
| RTX 5090 Laptop GPU | 8,145 | 53 |
| RTX 5080 Laptop GPU | 7,033 | 156 |
| RTX 4090 Laptop GPU | 6,332 | 65 |
| RTX 4080 Laptop GPU | 5,340 | 15 |
| RTX 5070 Ti Laptop GPU | 5,087 | 85 |
| RTX 5070 Laptop GPU | 3,969 | 63 |
| RTX 4070 Laptop GPU | 3,396 | 38 |
| RTX 5060 Laptop GPU | 3,266 | 144 |
| RTX 3080 Ti Laptop GPU | 3,246 | 9 |
| RTX 4060 Laptop GPU | 2,935 | 112 |
| RTX 3080 Laptop GPU | 2,746 | 4 |
| RTX 3070 Ti Laptop GPU | 2,652 | 14 |
| RTX 5050 Laptop GPU | 2,561 | 104 |
| RTX 3070 Laptop GPU | 2,493 | 36 |
| RTX 4050 Laptop GPU | 2,407 | 69 |
| RTX 3060 Laptop GPU | 1,957 | 46 |
A few things stand out. A newer generation with a smaller model number is not always faster. The RTX 5060 Laptop GPU (3,266) is close to the previous-generation RTX 4070 Laptop GPU (3,396), and almost the same as the RTX 3080 Ti Laptop GPU (3,246), a high-end chip from two generations back. The other way round, going from the RTX 3060 Laptop GPU (1,957) to the RTX 4060 Laptop GPU (2,935) raises the score about 1.5 times. The RTX 4080 (15), RTX 3080 Ti (9) and RTX 3080 (4) Laptop GPUs have few results, so read their values with more care than the others.
5. What to watch when reading scores
| Watch out | Why |
|---|---|
| It is a Cycles score | EEVEE and viewport speed are separate. For EEVEE you have to measure yourself, as in EEVEE render times on an 8 GB laptop GPU |
| Graphics memory (VRAM) is not in the score | The score is speed only. Big scenes may not render at all if memory runs out |
| The same laptop chip differs by laptop | Makers set power and cooling differently, so results for one chip can spread. That is why the median is used instead of the average |
| Compare the same version | Render speed can change between Blender versions, so compare results from the same version (for example 5.2.0) |
| Be careful with few results | One or two machines cannot represent a whole device |
The same chip scores differently in different versions. Switching the version in the filter sentence to 4.5.0 and searching for 4070 Laptop gave the RTX 4070 Laptop GPU a median of 3,549 from 231 results, compared with 3,396 from 38 results in 5.2.0. Each version also has a different set of laptops and a different number of results, so do not mix scores from different versions.
In short, an Open Data score is best for seeing roughly where a chip stands when rendering with Cycles. Weigh it together with memory size, the laptop's weight and noise, and the render engine you mostly use.
If you want to measure your own computer, you can get the benchmark program with Download Benchmark for Windows on the home page. The benchmark collects non-identifiable system information, such as the operating system, along with the result.
Common mistakes and fixes
| Symptom | Cause | Fix |
|---|---|---|
| My graphics card is not in the table | Part of the name differs, or the chosen version has no results | Search with just the number, and switch the version field and click Search |
| Review rankings differ from Open Data | Reviews use other scenes, engines and settings | Compare only Open Data values from the same Blender version |
| I bought a high-scoring card but a big scene will not render | The score is speed only, memory is separate | Check VRAM size separately before buying |
| My laptop scores lower than the table | Performance changes with power connection and power mode | Plug in and measure again under the same conditions |
Summary
An Open Data score is the sum of samples Cycles renders per minute. Compare the median and the number of results within the same version, and check memory and EEVEE speed separately.
References
- Blender Open Data: https://opendata.blender.org/
- Blender Open Data About (score definition, collected data): https://opendata.blender.org/about/
- Blender 5.2 manual, GPU rendering (CUDA, OptiX, HIP, oneAPI, Metal): https://docs.blender.org/manual/en/5.2/render/cycles/gpu_rendering.html
- Pictures: screenshots of the Open Data site (taken without signing in) and of the Blender 5.2.1 Preferences