How laptop energy saver affects render times, and how to check it: why Blender renders do not change when you switch power modes
On a Windows 11 laptop with energy saver on, switching the power mode to best performance does not actually take effect. This guide shows where to check energy saver, Always use energy saver, and the power plan, what happened when we rendered the same Blender 5.2.1 EEVEE scene three times in each of the three power modes on an RTX 4070 Laptop GPU laptop with energy saver on, and how to time renders in Blender.
한국어English
ON THIS PAGE
- 011. The short answer
- 022. Power mode and energy saver
- 033. Checking "Always use energy saver"
- 044. Checking the power plan in Control Panel
- 055. Results of changing the power mode with energy saver on
- 066. Timing renders in Blender
- 077. When times swung widely: programs running alongside
- 088. Checking the driver and the graphics card
- 099. Turning energy saver off and comparing yourself
- 10Common mistakes and fixes
- 11In one line
- 12References
Based on: Windows 11 Pro (power mode and energy saver), Blender 5.2 LTS (measured with 5.2.1, EEVEE), NVIDIA GeForce RTX 4070 Laptop GPU 8 GB (driver 610.62). Measured on my PC on November 1, 2026. The figures are real Windows Settings, Control Panel, and Blender screens, and a chart drawn from the measured values. Red numbers and outlines were added for explanation.
When rendering on a laptop, you often hear that switching the power mode to best performance makes it faster. But if Windows 11 energy saver is on, changing the power mode does not actually take effect. My laptop was in that state, and when I rendered the same scene in each of the three power modes, the times were almost the same.
This guide covers where to check whether energy saver is on, the measured results of changing the power mode with it on, and how to time renders in Blender. There are no measurements with energy saver off, so this guide cannot answer how much faster rendering gets when the power mode really takes effect.
1. The short answer
| Question | What I found on my PC |
|---|---|
| When energy saver is on | Settings shows "The power mode can't be set while energy saver is on," and the value in the power mode field does not apply |
| Changing the power mode with it on | Whichever mode was chosen, the mode Windows actually used was "best power efficiency" every time |
| Render times then | One 1920x1080 frame 0.44, 0.44, 0.47 s; 48-frame animation 14.2, 14.7, 14.6 s, effectively the same |
| When times swung widely | Rounds where other work (other Blender renders, a game engine editor) was running. With the same settings, one frame ranged from 0.43 s to 9.69 s (the cause was not pinned down) |
| Where to look first | The Energy saver row under Power & battery, and Always use energy saver inside it |
In short, before changing the power mode, check whether energy saver is off. And in this test, rounds overlapping with other work were far slower than any difference between power modes.
2. Power mode and energy saver
Windows 11 has two settings that look similar.
| Setting | What it does | Values |
|---|---|---|
| Power mode | Sets the balance between performance and power use | Best power efficiency, Balanced, Best performance |
| Energy saver | Manages the whole system together to reduce power use | On / off, turn on automatically at a battery percentage, always use |
Think of a car: the power mode is the drive mode dial (eco, normal, sport), and energy saver is a "fuel economy first" lock on top of it. With the lock on, turning the dial to sport still drives in eco.
The power mode is changed under Start › Settings › System › Power & battery. Energy saver arrived with Windows 11 24H2, and while energy saver is on, the power mode cannot be changed in Settings. Energy saver can also be set to stay on even while the adapter is plugged in.
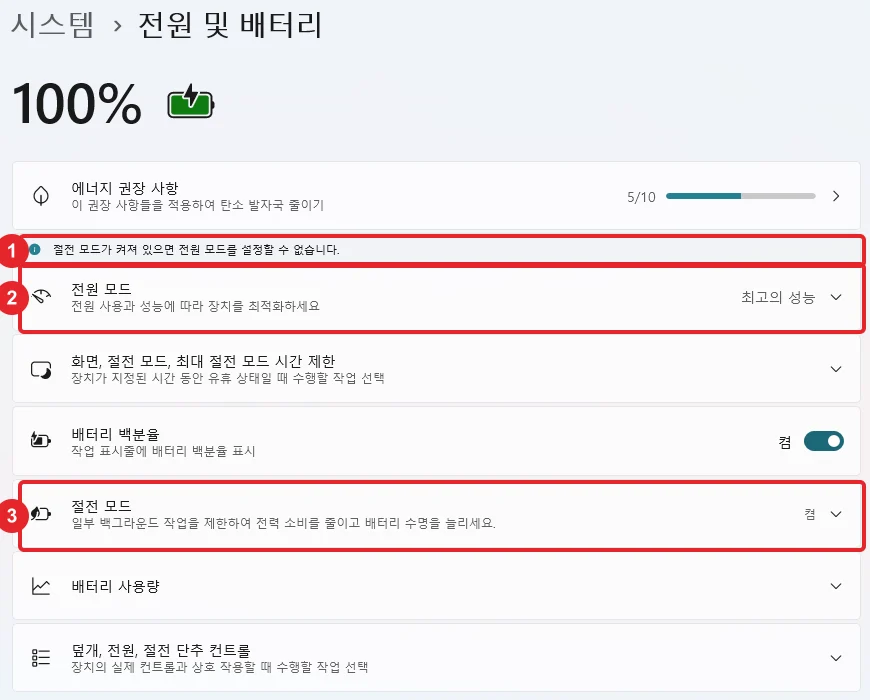 Figure 1. Power settings on the test laptop (Korean UI). ① Notice that the power mode cannot be changed because energy saver is on ② The power mode shows Best performance ③ Energy saver on (Windows Settings screenshot)
Steps: Open the same place on your laptop.
- Open Start › Settings › System › Power & battery.
- Check whether the Energy saver row says on or off (Figure 1, ③).
- Check whether a notice like Figure 1, ① appears above the power mode row. If it does, the power mode does not actually change, whatever the field says.
As in Figure 1, the power mode field can say "Best performance" while the notice shows that the value is not in effect. Looking at the screen alone, it is easy to think you are running in performance mode.
3. Checking "Always use energy saver"
If energy saver is on even with the adapter plugged in, look at the settings inside the Energy saver row.
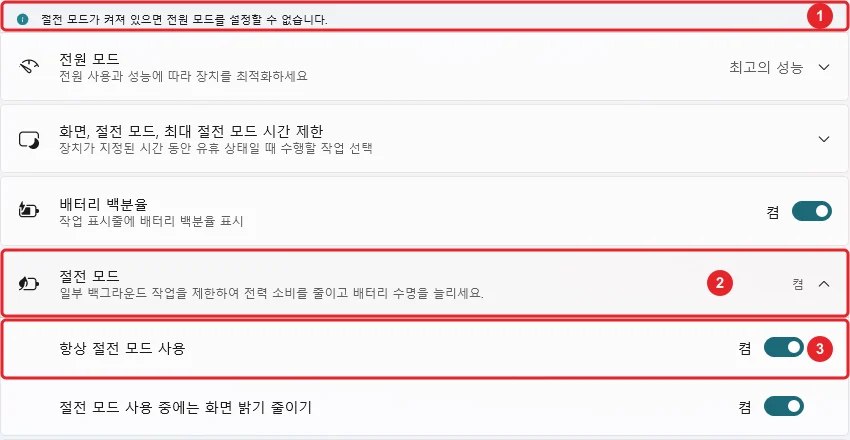 Figure 2. The Energy saver row expanded. ① Notice that the power mode cannot be set ② Energy saver on ③ Always use energy saver on (Windows Settings screenshot, Korean UI)
Steps:
- On the Power & battery screen, click the arrow at the right of the Energy saver row to expand it (Figure 2, ②).
- Check whether Always use energy saver is on (Figure 2, ③). If it is, energy saver stays on regardless of battery level or the adapter.
- If you want performance mode while rendering, turn this off and check that the notice in Figure 1 disappears.
As in Figure 2, Always use energy saver was on on my laptop. That is why energy saver was on even with the adapter plugged in and the battery at 100%. The laptop's owner chose this setting, so I did not turn it off this time.
4. Checking the power plan in Control Panel
There is one more reason the power mode field may not change. If a custom power plan is in use, the power mode cannot be changed, and switching back to "Balanced" fixes it.
 Figure 3. ① The selected power plan "Balanced" in Control Panel Power Options (Windows Control Panel screenshot, Korean UI)
Steps:
- Click Start, type Control Panel, and open it.
- Open Hardware and Sound › Power Options.
- Check that the selected plan is Balanced (Figure 3, ①). If it is another name (a plan you made), switch to Balanced.
My laptop was on Balanced, as in Figure 3. So the reason the power mode did not apply was energy saver, not the power plan.
5. Results of changing the power mode with energy saver on
Test setup
| Item | Value |
|---|---|
| Laptop | Acer Predator PHN16-72 |
| Graphics card | NVIDIA GeForce RTX 4070 Laptop GPU 8 GB (driver 610.62). This laptop also has Intel UHD Graphics |
| CPU and RAM | Intel Core i9-14900HX, 32 GB |
| Operating system | Windows 11 Pro, power plan "Balanced" |
| Power | Adapter plugged in, battery 100% |
| Energy saver | On, Always use energy saver on (not changed) |
| Blender | 5.2.1 LTS, EEVEE, run without a window (in the background) |
Method
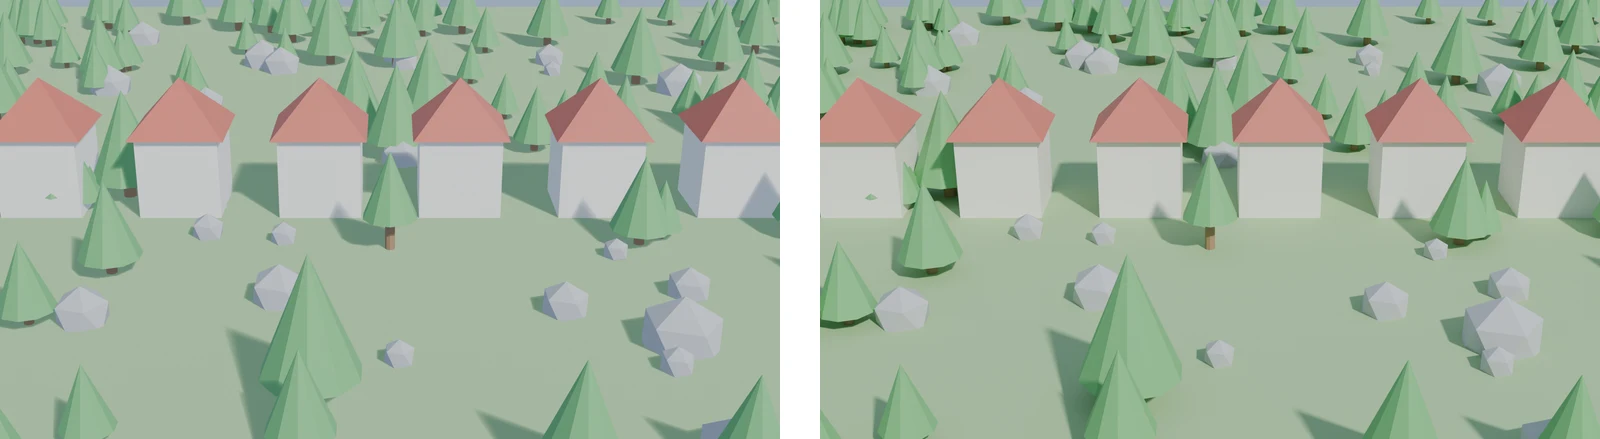
The test scene is the same village as the "medium scene" in Blender EEVEE on an 8 GB laptop GPU: about 300 trees, 80 rocks, and 6 houses, for 383 objects.
- Pick a power mode and wait 20 seconds, to let the new setting settle.
- Start Blender fresh and build the scene.
- Single frame test: render one frame at 1920x1080 with 64 samples and discard it, then render 10 more frames and take the average.
- Animation test: render 48 frames of the camera circling the village at 1280x720 with 32 samples. Saving PNG files is included in the time.
- Going through all three modes once is one round. Do three rounds, changing the order of modes each round, so that the laptop slowly heating up does not affect only one mode.
- Each time, read and record the power mode Windows is actually applying.
After measuring, the power mode was set back to its original value (best performance).
Results
| Power mode (selected) | Mode actually applied | One frame (s), rounds 1, 2, 3 | Median | 48 frames (s), rounds 1, 2, 3 | Median |
|---|---|---|---|---|---|
| Best power efficiency | Best power efficiency | 0.437 · 0.438 · 0.439 | 0.44 | 14.16 · 14.17 · 15.19 | 14.2 |
| Balanced | Best power efficiency | 0.437 · 0.438 · 0.434 | 0.44 | 14.66 · 14.33 · 16.42 | 14.7 |
| Best performance | Best power efficiency | 0.494 · 0.466 · 0.451 | 0.47 | 17.79 · 14.55 · 14.56 | 14.6 |
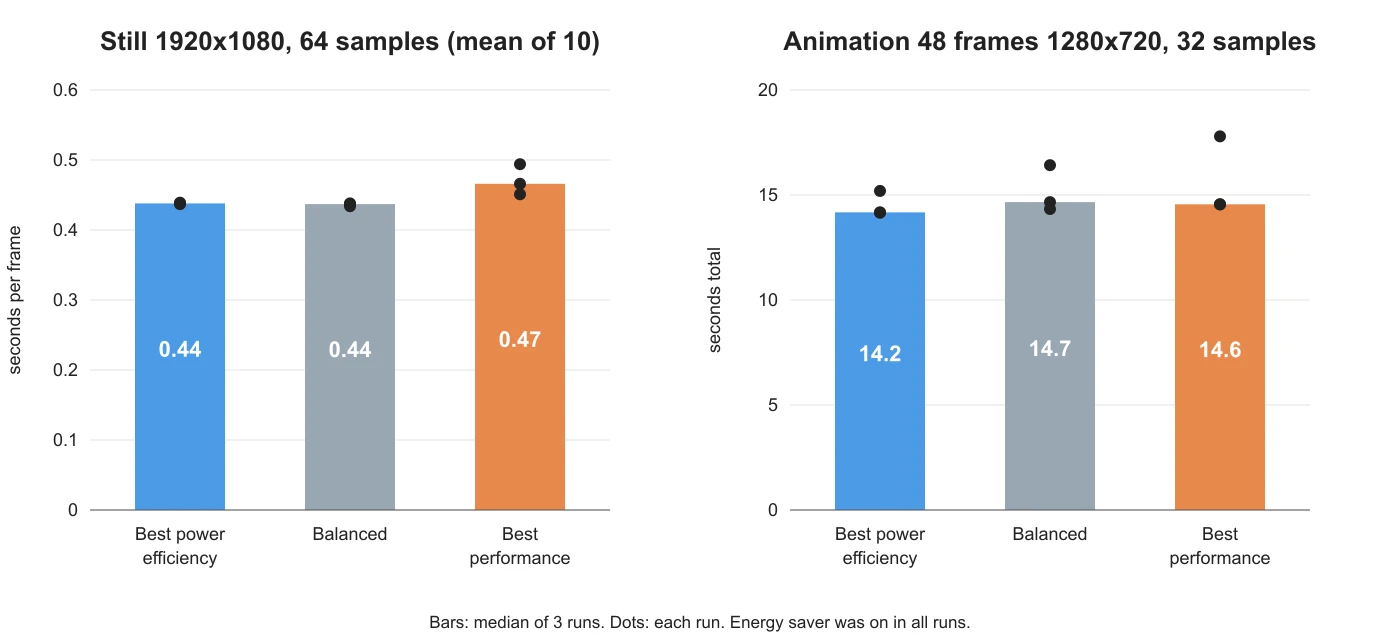 Figure 4. Render time by selected power mode with energy saver on. Bars are the median of three runs, and dots are each run (chart drawn from measured values)
Reading the chart: The bars are almost the same height. In the right chart, the three dots of one mode spread further apart (14.6 to 17.8 s for best performance) than the modes differ from each other. Since all three rows actually ran in the same mode, this is what you would expect.
The graphics card clock recorded during the runs was 2520 MHz in all three modes, and the median power draw while rendering varied between 46 and 56 W from run to run.
This table is not "the difference between three power modes" but "what happens when you change only the power mode field on a laptop with energy saver on." The difference with energy saver off and the power mode really applied was not measured. Also, this scene takes under half a second per frame, and most of the work is done by the graphics card. How energy saver affects work where the CPU is busy for a long time (physics, loading large scenes, compression) was not measured either.
6. Timing renders in Blender
You do not need to run Blender without a window. When you render with F12 in Blender, the time taken is shown too.
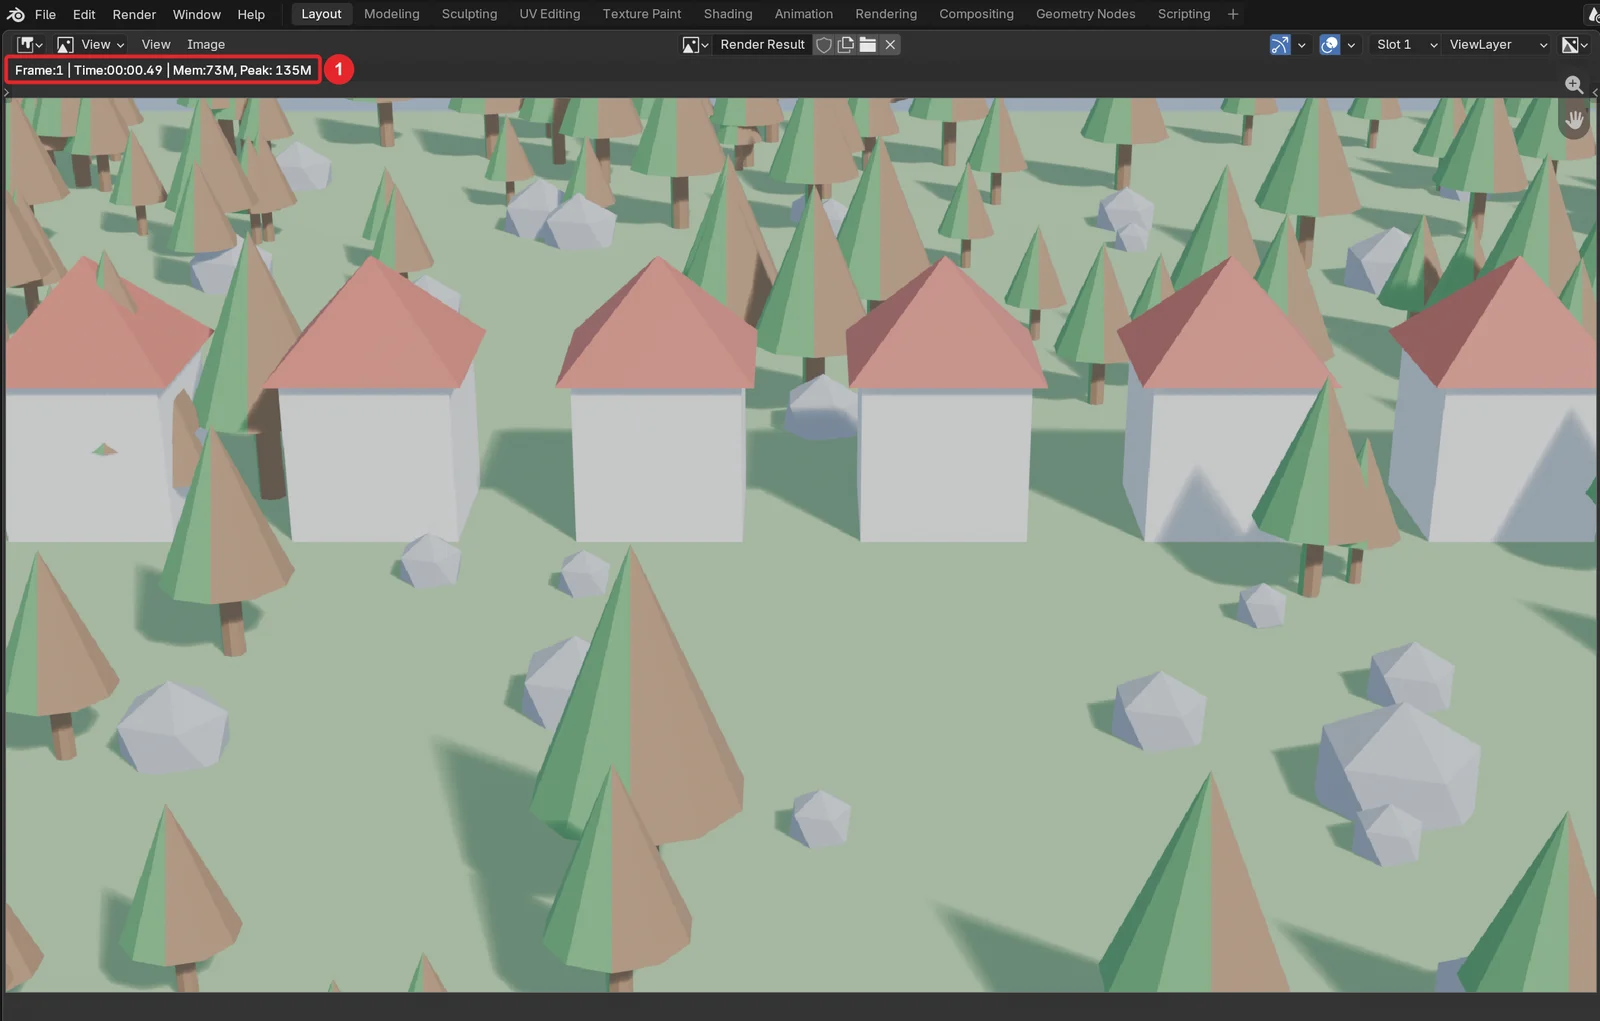 Figure 5. Render result of the same village scene. ① Time taken, 00:00.49 (Blender screenshot)
Steps:
- Open the scene you want to time in Blender.
- Press
F12to render one frame. Time appears at the top left of the render result (Figure 5, ①). - The first frame includes preparation time, so discard it, render the same scene two or three more times, and write down Time.
- After changing a setting, time again in the same way and compare medians.
Figure 5 was taken in the Blender window at a different time from the table's measurements, so the time differs slightly from the table. A time measured with the window open also includes drawing the screen, so compare only values measured the same way.
7. When times swung widely: programs running alongside
Before the third run shown in the table, I ran the same test once more, longer (five rounds). Other work was running at the time: other Blender renders and windows, and a game engine editor (Unreal Engine) opened for another guide in this series.
| Run | One frame with the same settings (average of 10) |
|---|---|
| Third run (no other heavy programs) | 0.43 to 0.49 s |
| Second run (including rounds with other work overlapping) | 0.43 to 9.69 s |
The slowest round took 9.69 s per frame, more than 20 times the usual. In the slow rounds, the median graphics card clock recorded was 210 to 600 MHz, far below the usual 2520 MHz. I could not pin down which work had how much effect. But in this test, rounds overlapping with other work were far slower than any change of power mode. In a later test on the same laptop, taking a windowless Blender run with Energy saver on out of power throttling, for that program only, made the same renders 5–12x faster. That may be another cause of this kind of scatter. It is covered in section 6 of Finding the bottleneck in your computer.
Steps: Before comparing render times or starting a long render, do the following.
- Close games, game engines, other 3D programs, and video editors.
- Press
Ctrl+Alt+Delete, choose Task Manager, and check on the Performance tab that GPU usage is low. - Plug in the adapter.
8. Checking the driver and the graphics card
This test did not change the driver version. When rendering is oddly slow, check in this order (from the Windows NVIDIA troubleshooting page of the Blender 5.2 manual).
| Check | Details |
|---|---|
| Driver version | Upgrading to the latest graphics drivers often solves problems. Use official drivers from the graphics card maker |
| Two graphics cards in a laptop | Laptops often have a power-saving onboard GPU and a faster dedicated GPU, and for best performance Blender should use the dedicated GPU |
| Which card Blender uses | The OpenGL section of the file saved with Help › Save System Info lists the graphics card and driver version |
This laptop also has two graphics cards (RTX 4070 Laptop GPU and Intel UHD Graphics). If rendering is oddly slow, first check which one Blender is using.
Steps:
- In Blender, choose Help › Save System Info and save the file.
- Open the saved file in Notepad and check that the graphics card name in the OpenGL section is the dedicated GPU (for example, NVIDIA GeForce …).
- Write down the driver version too. If you re-time renders after changing the driver, you can compare the effect in numbers.
9. Turning energy saver off and comparing yourself
To see the effect of the power mode on your laptop, measure in this order.
- Following section 3, turn off Always use energy saver and Energy saver. Check that the notice in Figure 1 disappears and the power mode field can be changed.
- Following section 7, close other programs and plug in the adapter.
- Choose one scene to render. A scene that takes a few seconds per frame is easy to time.
- Pick a power mode, wait about a minute, then time the render as in section 6.
- Switch to another mode and repeat step 4. Go through this order two or three times and compare the medians.
- When done, set energy saver and the power mode back to their original values.
If the difference between modes is smaller than how much the same mode varies across runs, the power mode does not make much difference for that scene.
Common mistakes and fixes
| Symptom | Cause | Fix |
|---|---|---|
| I switched to best performance, but rendering is the same | Energy saver is on, so the power mode does not apply | Turn off energy saver under Power & battery |
| Energy saver is on even with the adapter plugged in | Always use energy saver is on | Expand the Energy saver row and turn off Always use energy saver |
| I can't change the power mode field | Energy saver is on, or a custom power plan is in use | Turn off energy saver, and choose "Balanced" in Control Panel Power Options |
| Render time jumps around for the same scene | Other programs may be running alongside | Close heavy programs and check GPU usage in Task Manager |
| Laptop rendering is far slower than a desktop | Blender may be using the onboard GPU | Check which card is used with Help › Save System Info |
| The first frame is always slow when measuring | The first render includes preparation time (shader setup) | Discard the first frame and time from the next one |
In one line
Check energy saver and "Always use energy saver" before the power mode, close other programs, discard the first frame, and compare medians of several runs.
References
- Microsoft Support, Change the power mode for your Windows PC: https://support.microsoft.com/en-us/windows/change-the-power-mode-for-your-windows-pc-c2aff038-22c9-f46d-5ca0-78696fdf2de8
- Microsoft Learn, Energy Saver: https://learn.microsoft.com/windows-hardware/design/component-guidelines/energy-saver
- Blender 5.2 LTS Manual, Troubleshooting Windows – NVIDIA: https://docs.blender.org/manual/en/5.2/troubleshooting/gpu/windows/nvidia.html
- Related guides on this site: Blender EEVEE on an 8 GB laptop GPU, Thermal throttling, Laptop vs desktop for Blender and 3D
- Shortcut: render
F12 - Figures: Windows Settings screens (the account area was cropped out), a Control Panel Power Options screen, a Blender 5.2.1 screen, and a chart drawn from measured values