Blender render cost: comparing your PC and cloud GPUs on one scale (measured example, with how render farms charge)
Starting from the time and graphics card power one Cycles frame took on my laptop, this post shows how to estimate the speedup on a cloud graphics card with Blender Open Data scores, multiply by the hourly rate (Secure Cloud and Community Cloud) to get the render cost, how render farms charge, and what to check before sending work out.
한국어English
ON THIS PAGE
- 011. The short answer
- 022. A scale for comparing costs
- 033. Measure one frame's time and power on your PC
- 044. How much faster is another card: Open Data scores
- 055. Multiply by the hourly rate to get the cost
- 066. The cost of your own PC: electricity and waiting
- 077. How render farms charge
- 088. What to check before sending work out
- 09Practice
- 10Common mistakes and fixes
- 11Summary
- 12References
Based on: Blender 5.2 LTS (measured with 5.2.1, Cycles), an NVIDIA GeForce RTX 4070 Laptop GPU with 8 GB (driver 610.62), Blender Open Data (Blender 5.2.0 results), and the RunPod pricing page. Checked and measured on November 4, 2026. Images are real renders and official site screenshots. Charts are calculated from measured and published values. Prices change often, so check the official pricing page again before you send work out.
Should you let your laptop render for hours, or pay to rent a faster graphics card? Everyone faces this once renders get long. You can answer it by putting "how long" and "how much" on the same scale.
This post shows how to build that scale. Measure the time for one frame on your PC, estimate how many times faster another graphics card would be using Blender's official benchmark scores, and multiply by the hourly rate. The example uses values I measured on my laptop with an RTX 4070 Laptop GPU. The post also covers how render farms charge and what to check before sending work out.
1. The short answer
| Question | Value in this post's example |
|---|---|
| One frame on my laptop | Cycles GPU, 1920x1080, 128 samples: 3.43 s. Graphics card power averaged 63.5 W |
| How much faster are other cards | By Open Data score ratio, RTX 4090 about 3.4x, RTX 5090 about 4.7x |
| A 72-hour laptop job on a rented card | RTX 4090 about 21 hours for about $19 (Secure Cloud rate) or about $7.2 (Community Cloud rate); RTX 5090 about 15 hours for about $18 or about $10.5 |
| Data-center cards | The A100 80GB scores about the same as the RTX 4070 Laptop GPU, so the same job costs about $88–132, more, not less (only 1 Open Data result for this card, so it may be off) |
| A short job (a 10-second clip of this scene) | About 14 minutes on the laptop. Renting saves less time than setup takes |
| Electricity on my own PC | Usually a small part of the cost. The real cost is waiting, and not being able to use the PC meanwhile |
In short, short jobs of a few seconds per frame are better on your own PC, and jobs that take days on your PC get much shorter when you rent. Pick cards by "price per unit of score", not by name or hourly rate.
2. A scale for comparing costs
It is like comparing a taxi with your own car. Your car is already paid for, so it looks like you only pay for fuel. But you cannot do anything else while driving. A taxi costs a fare, but it takes a faster route, and you can do other work meanwhile. Which is better depends on the distance and how much your time is worth.
Rendering is the same. Compare three things.
- Time: how long the same job takes in each place
- Money: time × cost per hour
- Setup and cleanup: time and money for uploading files, installing software, and getting results back
Turn all three into the same units (hours, and dollars or your local currency) and you can compare them. Cloud prices are usually listed in US dollars, so this post keeps the calculations in dollars. Convert at the exchange rate on the day you pay. The starting point is always the time for one frame, measured on your PC.
3. Measure one frame's time and power on your PC
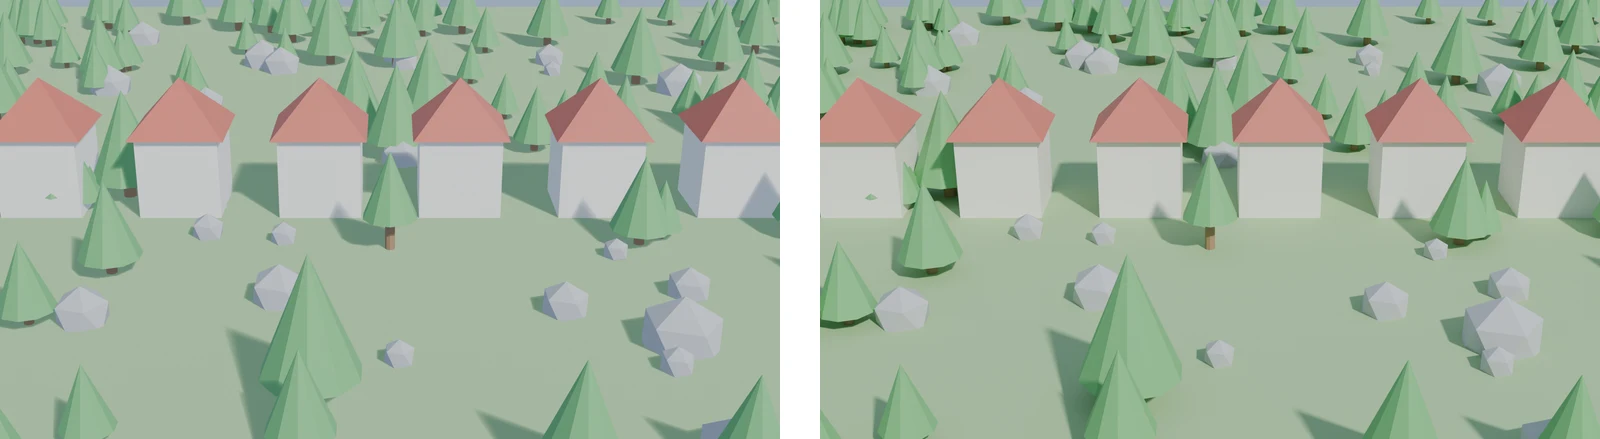 Figure 1. Test scene. Left is EEVEE; right is the Cycles render used for the calculations in this post (Blender render)
The test scene is a low-poly village with six houses, trees, and rocks (383 objects). I rendered it with Cycles.
| Item | Value |
|---|---|
| Laptop | Acer Predator PHN16-72, RTX 4070 Laptop GPU 8 GB, i9-14900HX |
| Render settings | Cycles, GPU (OptiX), 1920x1080, 128 samples, denoising on |
| Time per frame | 3.43 s (median of 5 frames, 3.36–3.48 s) |
| Graphics card power | 63.5 W on average while rendering, 79.3 W at the highest |
Follow along: Measure the same values with your scene.
- Open the scene you will render and set the render settings to the values you will really use.
- Press
F12to render one frame. The first frame includes setup time, so ignore it. - Press
F12again and write down the Time value shown at the top of the render window. Repeat two or three times and use the median. - On an NVIDIA card, run this line in a terminal while rendering to see the power (W).
nvidia-smi --query-gpu=power.draw,utilization.gpu --format=csv -l 1
- Estimate the whole animation as time per frame × number of frames. If the scene changes a lot from frame to frame, measure one frame each from the start, middle, and end, and average them.
A 10-second clip of this scene (24 fps, 240 frames) would take 3.43 s × 240 = about 823 s, or around 14 minutes.
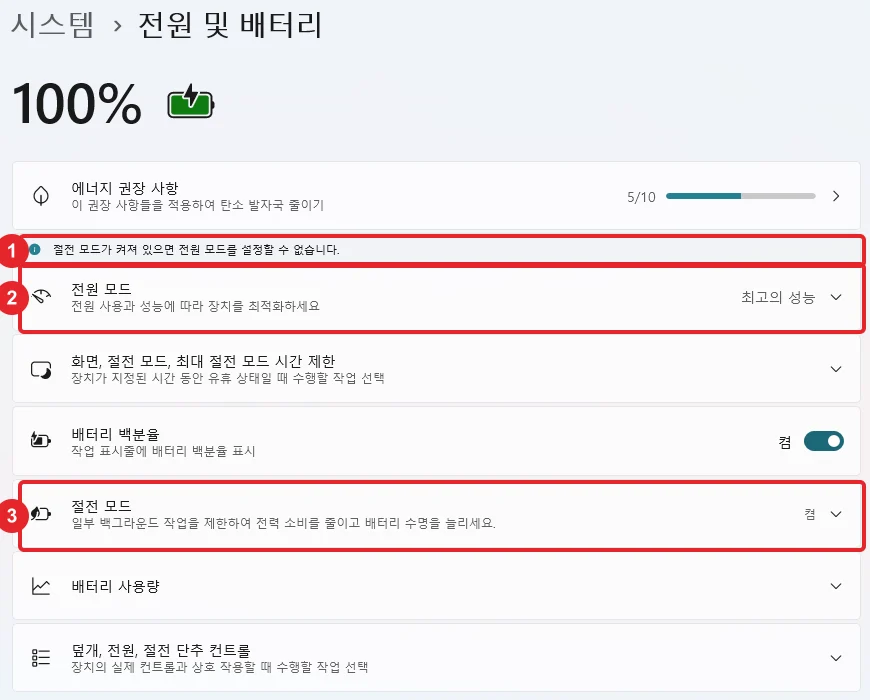
When rendering on a laptop, check Windows Energy saver first. On this laptop I saw the same render run more than 10x slower when Energy saver was on and Blender ran without a window. It is in section 6 of Finding the bottleneck in your computer.
4. How much faster is another card: Open Data scores
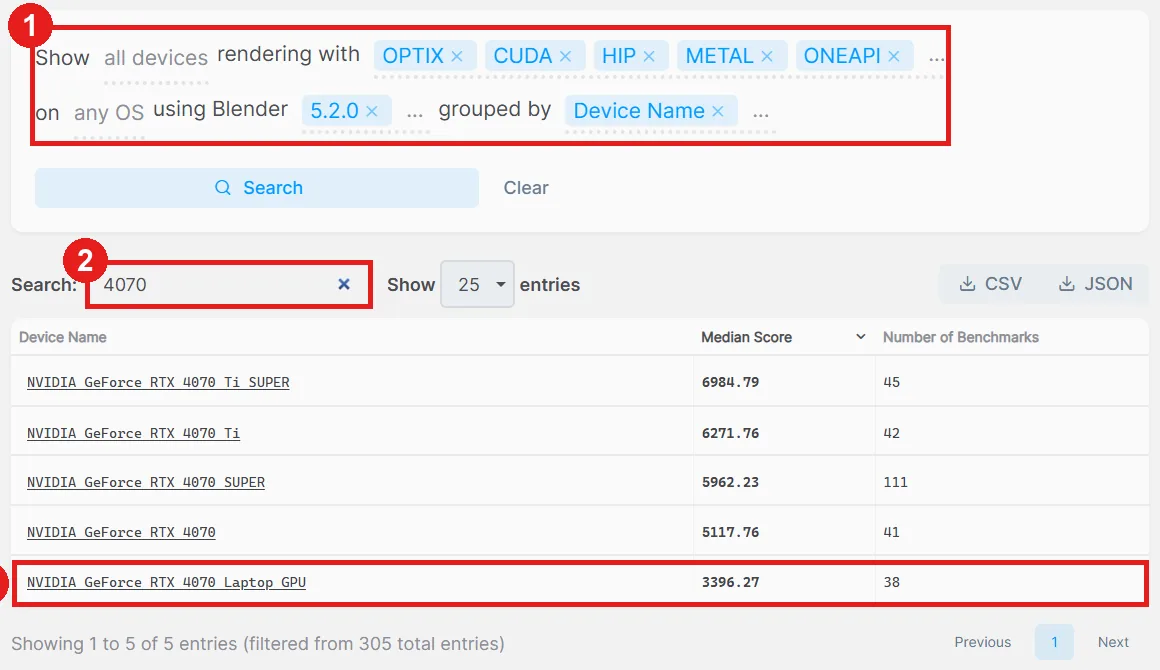
You cannot test a card you have not rented, so use scores from Open Data, Blender's official benchmark site. The score is close to the number of samples Cycles computes per minute, so a score twice as high means the same scene finishes in roughly half the time. How to find and read the scores is covered in How to read Blender Open Data benchmark results.
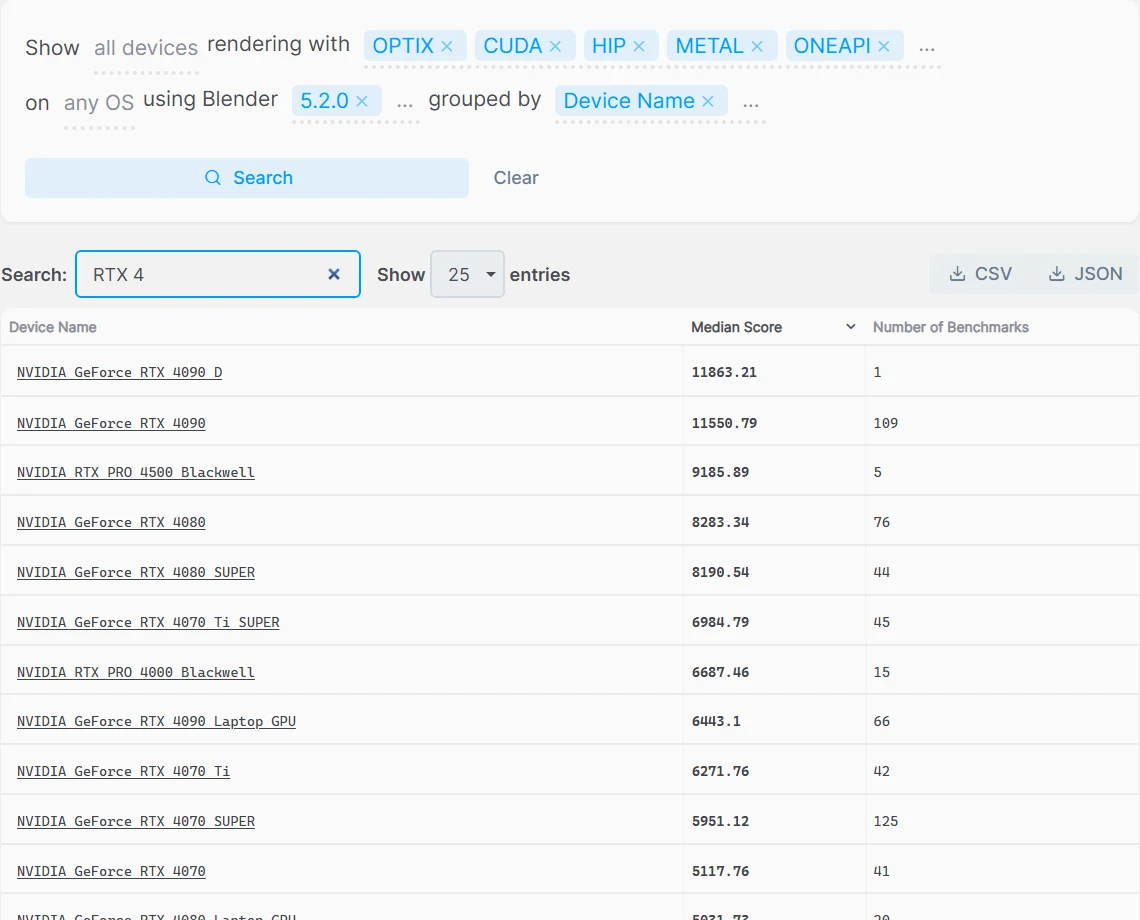 Figure 2. Open Data with Blender 5.2.0 results grouped by graphics card name and searched for RTX 4. Median Score and Number of Benchmarks (opendata.blender.org screenshot)
Follow along:
- Go to https://opendata.blender.org and click Search at the top.
- In the query sentence, choose a single Blender version (this post uses 5.2.0) and group by Device Name.
- Click the Search button, then type your card's name and the rented card's name into the box above the table, one at a time, and write down the scores.
- Rented card score ÷ your card score is a rough estimate of how many times faster it will be.
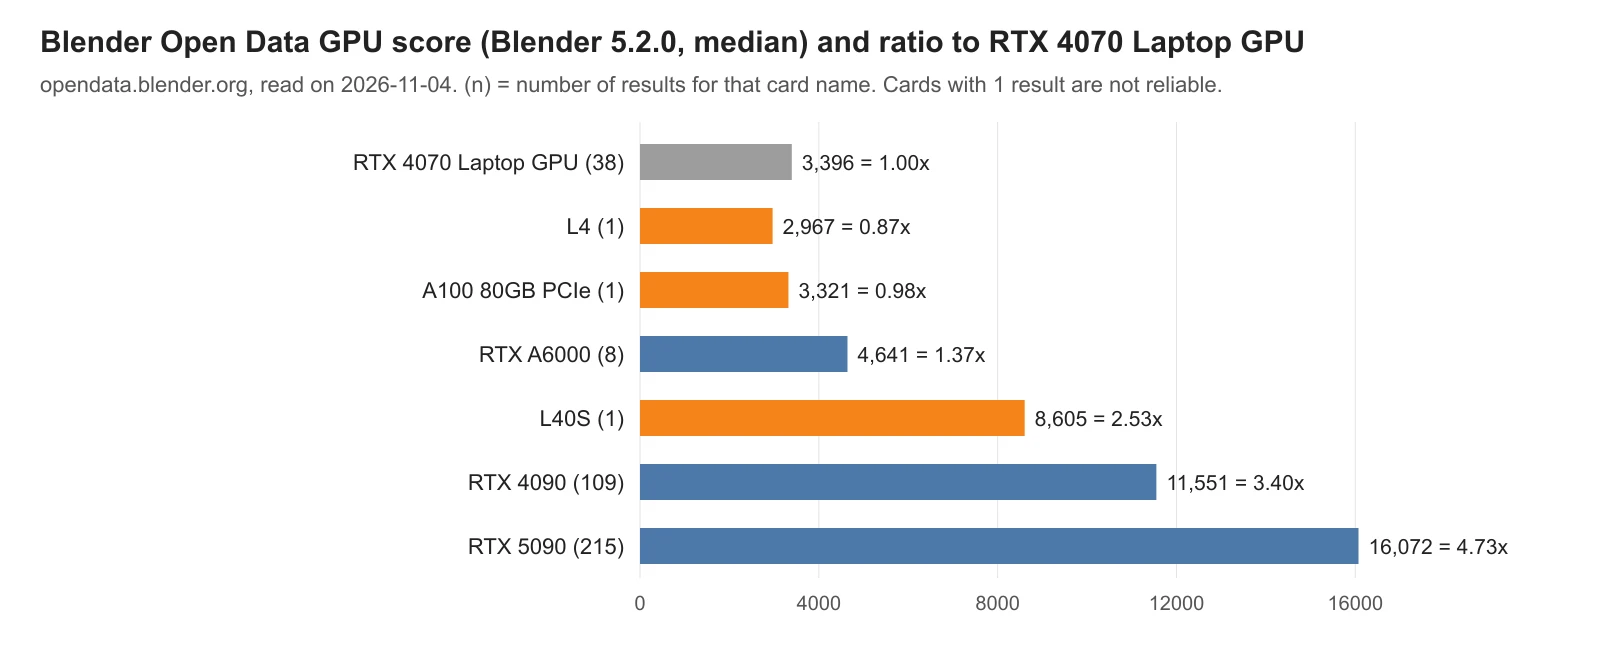 Figure 3. Open Data scores of graphics cards often rented in the cloud, and the ratio to the RTX 4070 Laptop GPU. Scores are the median of results for each card name; numbers in parentheses are result counts (chart)
The RTX 4070 Laptop GPU's 3,396 is not a measurement of my laptop. It is the median of 38 results uploaded for that card name. My 3.43 s and this score come from different scenes, so treat the ratio as a rough estimate.
One point stands out. Data-center cards are not always fast at rendering. The A100 80GB, widely used for AI training, scored 3,321, almost the same as the RTX 4070 Laptop GPU's 3,396. The L4 was similar at 2,967. Meanwhile, the RTX 4090 and 5090, made for gaming, were 3.4–4.7x. However, L40S, L4, and A100 each have only one result on Open Data, so their values may be off. For cards with few results, also look at other versions or more results.
Scores say nothing about memory size. Check separately whether the rented card's VRAM can hold your scene. Cloud cards usually have 24 GB or more, far more room than an 8 GB laptop.
5. Multiply by the hourly rate to get the cost
A cloud GPU service rents out computers with graphics cards by the hour. Below is the pricing table from one of them, RunPod.
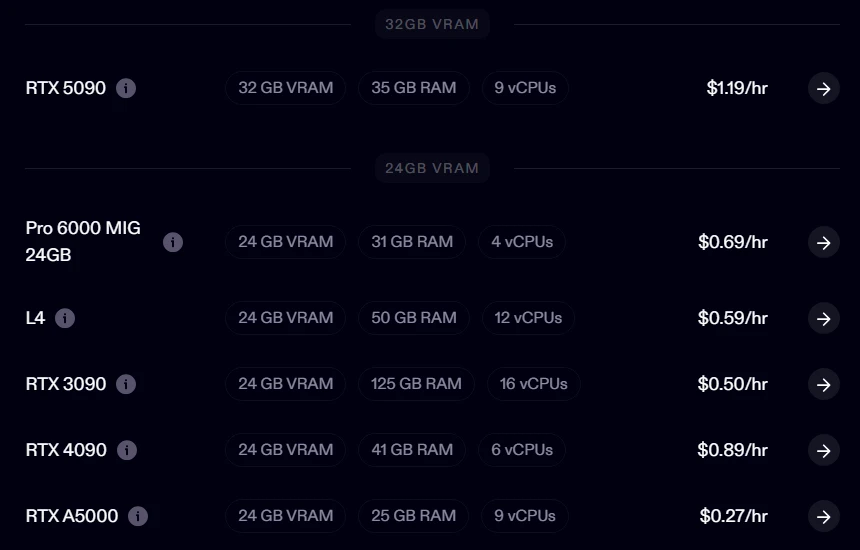 Figure 4. The 24 GB and 32 GB rows of the RunPod pricing table. Hourly rates in the default view (Secure Cloud) when I opened the page on the day I checked (runpod.io screenshot)
Clicking the Community Cloud button at the top of the same table shows other rates for the same cards.
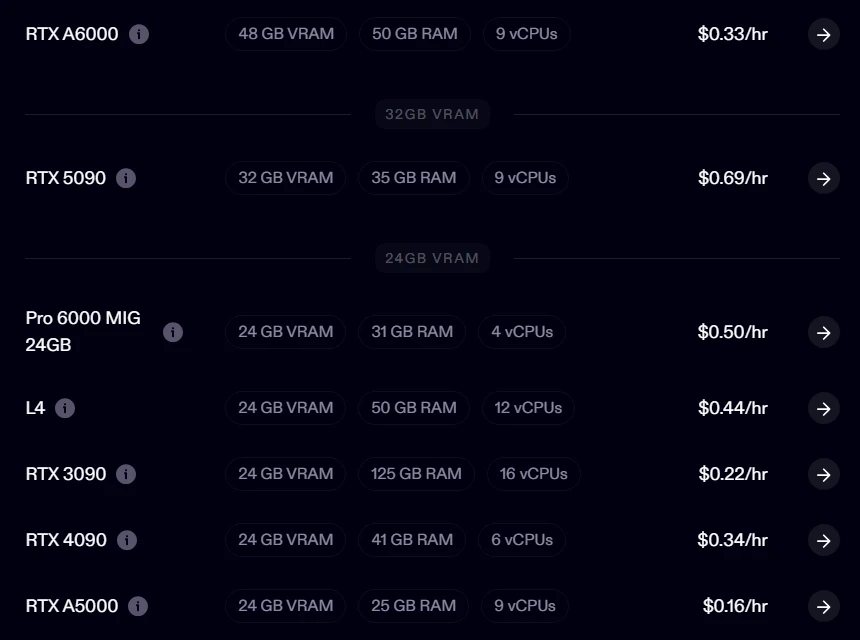 Figure 5. Hourly rates in the same table after clicking the Community Cloud button (runpod.io screenshot)
The two differ in where the computers are. Secure Cloud computers sit in T3/T4 data centers with high redundancy. Community Cloud links computers offered by many providers (peer-to-peer), so redundancy varies by machine. The suggested uses differ too: Secure Cloud for production and sensitive data, Community Cloud for cost-sensitive work (RunPod's comparison table). Renders you can simply run again are often fine on Community Cloud, but pick Secure Cloud for files others must not see.
The calculation goes like this.
Time on the rented card = time on my PC ÷ score ratio Rental cost = time on the rented card × hourly rate
For example, suppose a job takes 72 hours on my laptop. That is about the size of a 1-minute clip (24 fps, 1,440 frames) of a heavy scene that takes 3 minutes per frame. The 72 hours is a value chosen to explain the method.
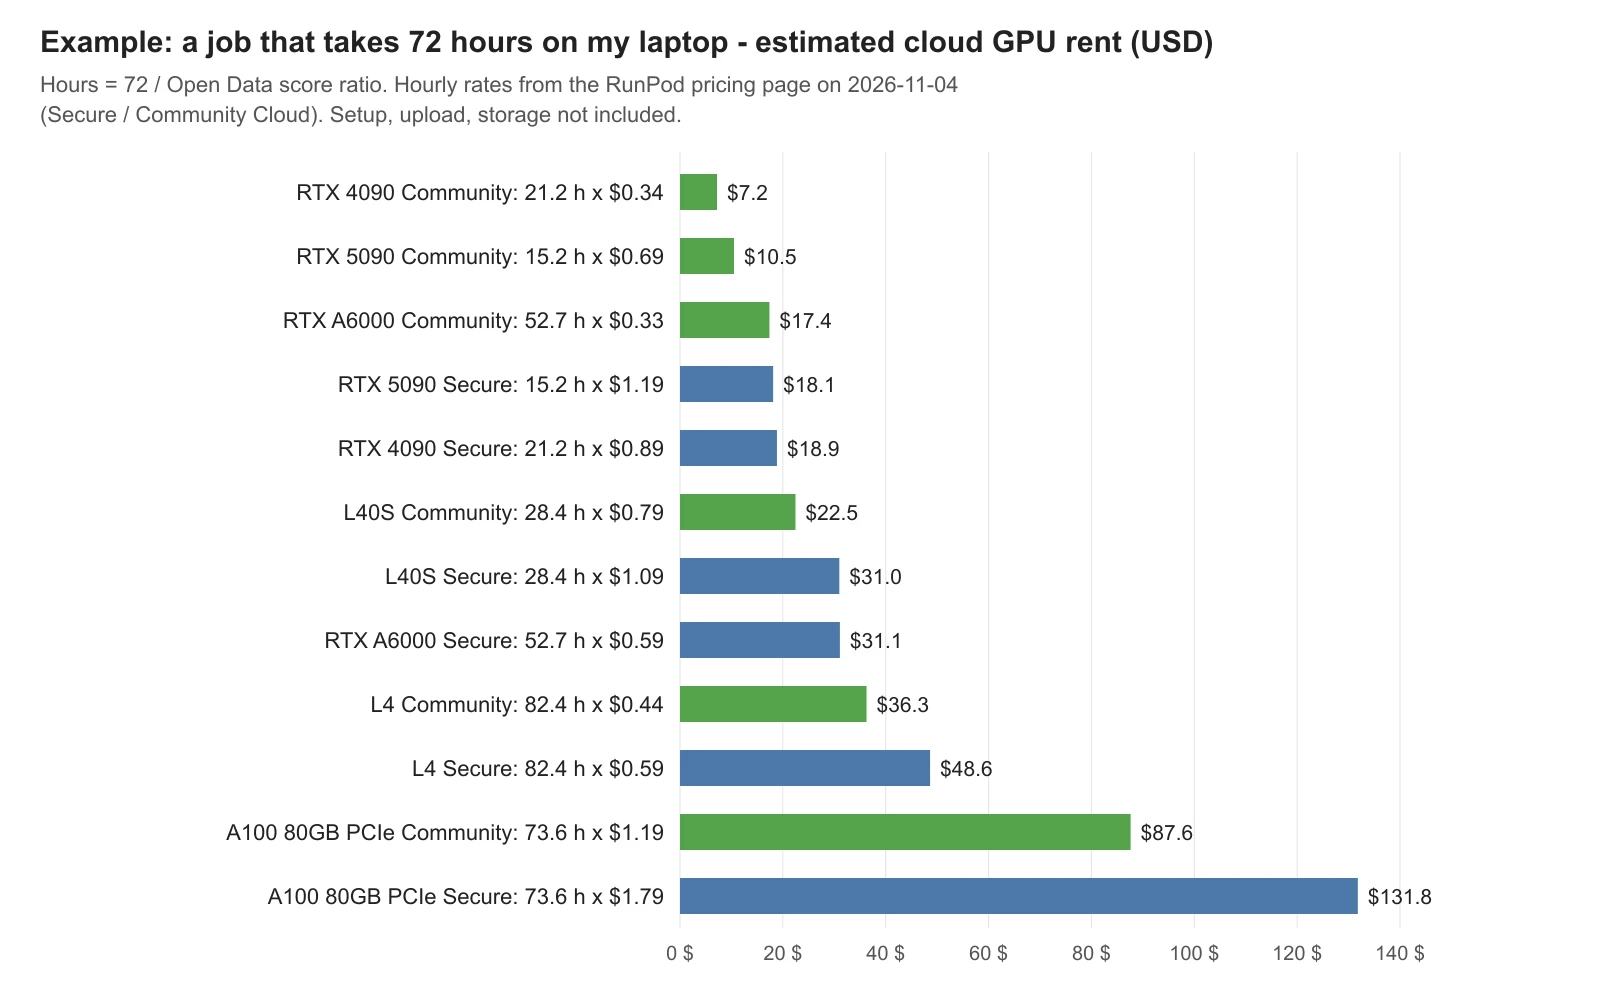 Figure 6. Estimated cost of a 72-hour laptop job on rented cards. Green is the Community Cloud rate, blue is the Secure Cloud rate. Setup, upload, and storage costs not included (chart)
| Card | Score ratio | Time | Secure Cloud rate → cost | Community Cloud rate → cost | Value of 1 laptop-hour of work (Secure / Community) |
|---|---|---|---|---|---|
| RTX 5090 | 4.73x | 15.2 h | $1.19 → about $18.1 | $0.69 → about $10.5 | about $0.25 / $0.15 |
| RTX 4090 | 3.40x | 21.2 h | $0.89 → about $18.9 | $0.34 → about $7.2 | about $0.26 / $0.10 |
| L40S | 2.53x | 28.4 h | $1.09 → about $31.0 | $0.79 → about $22.5 | about $0.43 / $0.31 |
| RTX A6000 | 1.37x | 52.7 h | $0.59 → about $31.1 | $0.33 → about $17.4 | about $0.43 / $0.24 |
| L4 | 0.87x | 82.4 h | $0.59 → about $48.6 | $0.44 → about $36.3 | about $0.68 / $0.50 |
| A100 80GB PCIe | 0.98x | 73.6 h | $1.79 → about $131.8 | $1.19 → about $87.6 | about $1.83 / $1.22 |
The last column is the scale this post uses. It means "what it costs to send out a job that would take one hour on my PC." At Secure Cloud rates, the RTX 5090 ($1.19 per hour) was cheaper by this scale than the RTX A6000, which has the lowest hourly rate ($0.59). It is faster, so you rent it for less time. Choosing by hourly rate alone loses money.
At Community Cloud rates, the same job drops to about $7.2 on an RTX 4090, roughly 40% of the Secure Cloud cost. Either way the steps are the same; only the number in the rate column changes.
You can also rent several cards at once. Frames of an animation are independent, so splitting the job across ten RTX 4090s turns 21 hours into a little over 2 hours. The total rented hours stay the same, so the cost stays about the same; only the setup cost grows with the number of machines.
This calculation leaves out a few things.
- Setup time: Renting and starting the computer, installing Blender, and uploading files are also billed. For short jobs this share can be bigger than the render itself.
- Storage cost: Storage for your files is billed separately. On the day I checked, the RunPod pricing page listed $0.05–0.20 per GB per month. The rate depends on the storage type and on whether the computer is running or stopped.
- Forgetting to stop: If you leave the computer running after the render ends, the charges continue.
- Score error: The score ratio is an estimate based on benchmark scenes. Your scene may differ.
If you send the short job from earlier (a 10-second clip of this scene, 14 minutes on the laptop) to an RTX 4090, the render takes about 4 minutes and costs less than $0.10. But renting and preparing the computer takes longer than that. Short jobs are better on your own PC.
6. The cost of your own PC: electricity and waiting
Rendering on your own PC costs two main things.
Electricity is smaller than you might think. This laptop's graphics card drew 63.5 W on average while rendering. Over 72 hours, that is about 4.6 kWh for the graphics card alone. I did not measure whole-PC power. As an example, if the whole PC draws 150 W, 72 hours is 10.8 kWh; multiply that by your electricity rate per kWh. The 150 W is a value chosen to show the calculation. Use your own rate and real power draw. A plug-in power meter can measure the whole PC's power.
Waiting is the bigger cost. For those 72 hours, this laptop can hardly do any other heavy work. If you work on something else while it renders, both slow down. Laptops running at full load for a long time get hot and loud. How much this time is worth differs from person to person. For a job with a deadline, the difference between 21 and 72 hours can matter much more than the fee.
Here is how to choose.
| Situation | Choose |
|---|---|
| Minutes to a few hours on your PC | Your PC. Saves setup time |
| Overnight or longer on your PC, with plenty of time | Render on your PC at night. Turn Energy saver off |
| Days on your PC, with a tight deadline | Rent a fast card or use a render farm |
| The scene does not fit in your VRAM | Rent a card with more VRAM |
| Jobs of the same size come every month | Compare the total rental cost with the price of a new card |
6-1. Buy a new card or rent when needed
If jobs of the same size keep coming, you can ask "when does the rental total reach the price of a new card?" The math is simple.
Hours you can rent before reaching the price of a new card = new card price ÷ hourly rate of the rented card
For example, if renting an RTX 4090-class card costs $0.89 per hour (Secure Cloud), $1,000 buys about 1,120 hours. Renting 8 hours every day, that is 140 days; renting 8 hours a day for 10 days a month (80 hours a month), it is about 14 months. At the Community Cloud rate ($0.34), the same money buys about 2,940 hours. The $1,000 is a value chosen to show the calculation. Use the real store price when you buy.
Also consider what this calculation leaves out.
- What you gain by buying: Not just renders, but screen work, Material Preview view, and local AI all get faster. A rented card only helps while rendering.
- What buying costs: A power supply and case that fit the card (desktop), electricity, and lower relative performance a few years later.
- The laptop limit: You cannot swap only the graphics card in a laptop. To get a faster card, you replace the whole laptop or set up a separate desktop. In this case, renting has a much lower entry cost.
If jobs come now and then in bursts, renting usually wins. If you render heavy scenes every day, buying usually wins. Either way, working out "the value of 1 laptop-hour of work" with sections 1–5 first makes the decision faster.
7. How render farms charge
A render farm splits your uploaded Blender file across many computers and sends back the results. Instead of renting a whole computer like a cloud GPU, you hand over only the rendering. The service handles installation and splitting, but each farm charges in its own, often unfamiliar, way. This post does not compare prices between farms; it only explains the methods so you can read them.
| Method | Meaning | Comparison |
|---|---|---|
| Node-hour | One render computer (node) used for one hour. For example, one render farm pricing page (see sources) lists CPU rates "per node per hour" | renting one taxi for one hour |
| Performance score × hours | A computer's performance score multiplied by the time used. For GPU rendering, some farms use "OB-hours", which multiply by OctaneBench, OTOY's graphics card benchmark | machine performance score × time run |
Farms multiply by performance because computers in a farm differ in speed, so "how many hours" alone is not fair. Multiplying by performance means the same job is priced about the same whether it lands on a fast computer and finishes quickly or on a slow one and takes longer.
To compare a render farm quote with your PC:
- In the farm's pricing table, check the method (node-hours, or a performance score multiplied in), the unit price, and the priority (faster processing costs more).
- Most farms give an estimated cost through a cost calculator or a test render once you upload the scene. This is the most accurate.
- Divide the estimated cost by the time the job takes on your PC to get "the value of 1 hour of my PC's work." Then you can compare it on the same scale as the table in section 5.
Farms differ in the Blender versions, add-ons, and render engines they support. Before sending work, make sure they support your file's version and the add-ons you use.
8. What to check before sending work out
Whether you use a cloud GPU or a render farm, checking these items saves wasted money.
Follow along:
- Pack textures into the file. In Blender, choose File ‣ External Data ‣ Pack Resources to put image files inside the
.blend. If you skip this, materials show up magenta on the rented computer. - Render one frame on your PC first. Catch mistakes (camera, resolution, samples) before sending.
- Output an image sequence. In the Output tab, choose an image format such as PNG or OpenEXR. If the job stops halfway, the finished frames stay and you only rerun the rest. If you output straight to a video file, a stop means starting over.
- Match the Blender version. If the rented computer or farm uses a different Blender version from your file, results can differ.
- Stop as soon as it is done. A cloud GPU charges for as long as it is running. After downloading the results, shut down the computer and clean up storage.
Practice
- Render a scene you often use three times with
F12, and write down the Time values of the two frames after the first. - Calculate how many hours a 30-second clip (24 fps) of that scene would take on your PC.
- Find the scores of your graphics card and the RTX 4090 on Open Data, and calculate how many times faster it would be. Choose the same version for both.
- Find the RTX 4090's hourly rate in a cloud pricing table, and calculate what the job in step 2 would cost.
- Divide the value from step 4 by the hours from step 2, and write down "the value of 1 hour of my PC's work." Next time a similar job comes, you can estimate with this number right away.
Common mistakes and fixes
| Symptom | Cause | Fix |
|---|---|---|
| You rented the card with the lowest hourly rate, but the total came out higher | It was slow, so you rented it longer | Compare by "price per unit of score" or "value of 1 hour of my PC's work" |
| You rented a data-center card, but rendering is not fast | Some cards have low render scores | Check the card's score on Open Data before renting |
| Materials come out magenta on the rented computer | Texture files did not come along | Pack the images into the file with Pack Resources |
| Charges continue after the render ended | The computer or storage is still on | Shut down and delete right after downloading results |
| You estimated your PC's time, but it took much longer | Energy saver, overlapping work, different time per frame | Turn Energy saver off, measure the start, middle, and end frames separately |
| You sent a short job but got it back later than expected | Setup and upload took longer than the render | Keep jobs of a few minutes on your PC |
Summary
Measure one frame on your PC, divide by the Open Data score ratio, multiply by the hourly rate, and compare by "the value of 1 hour of my PC's work."
References
- Blender Open Data: https://opendata.blender.org/
- Blender Open Data about page (what the score means): https://opendata.blender.org/about/
- RunPod pricing: https://www.runpod.io/pricing
- RunPod docs, Secure Cloud vs Community Cloud: https://docs.runpod.io/pods/choose-a-pod
- Blender manual, GPU rendering: https://docs.blender.org/manual/en/5.2/render/cycles/gpu_rendering.html
- Blender manual, packed data (Pack Resources): https://docs.blender.org/manual/en/5.2/files/blend/packed_data.html
- OTOY, OctaneBench (graphics card benchmark): https://render.otoy.com/octanebench/
- An example render farm pricing page (Fox Renderfarm, node-hours): https://www.foxrenderfarm.com/pricing.html
- Images: renders were made for this post with Blender 5.2.1; Open Data and RunPod are screenshots of each site; charts are calculated from measured and published values.