Finding the bottleneck in your computer: measure before you upgrade for Blender and AI work (8 GB laptop, measured)
Follow along to measure which part fills up (CPU, GPU, RAM, or VRAM) while Blender renders and simulates. The post shows results for four jobs on an RTX 4070 Laptop GPU laptop, a case where Windows Energy saver made the same jobs 5–12x slower, and how to decide what to upgrade first based on the results.
한국어English
ON THIS PAGE
- 011. The short answer
- 022. What a bottleneck is
- 033. Two tools for measuring
- 044. Four test jobs
- 055. Which part is busy in each job
- 066. When the bottleneck is a setting, not a part: Energy saver
- 077. Memory bottlenecks: room left in RAM and VRAM
- 088. Upgrade order based on the results
- 099. Comparing with the official recommended specs
- 10Practice
- 11Common mistakes and fixes
- 12Summary
- 13References
Based on: Blender 5.2 LTS (measured with 5.2.1), Windows 11 Task Manager, nvidia-smi from NVIDIA driver 610.62, the Microsoft Learn Quality of Service page, and the blender.org requirements page. Measured on my PC on November 4, 2026. Images are real renders and a blender.org screenshot. Charts are drawn from the measured values.
When your computer feels slow, what should you change to make it faster? Before deciding whether to replace the graphics card, add RAM, or buy a new laptop with a better CPU, there is one step to take first. Measure which part is full during the work you actually do. The full part is the bottleneck. If you replace a part that is not the bottleneck, you spend money and nothing gets faster.
This post explains how to find the bottleneck with Windows Task Manager and NVIDIA's measuring tool. Then it shows results from four Blender jobs on a laptop with an RTX 4070 Laptop GPU (8 GB of graphics memory). When I measured, the biggest bottleneck was not a part but a Windows setting. The same jobs ran 5–12x slower because of that one setting. The post covers that case and the order for deciding what to change based on the results.
1. The short answer
| Question | What I measured on my PC |
|---|---|
| Rendering Cycles on the CPU | CPU 98%, GPU 2%. CPU is the bottleneck |
| Rendering Cycles on the GPU | GPU 74%, CPU 19%. GPU is the bottleneck |
| Cloth simulation (60 frames) | CPU 47%, GPU 5%. It is CPU work, so a new graphics card will not speed it up |
| Graphics memory (VRAM) | About 2.5 GB at most in the test scene. Under 1/3 of 8 GB |
| RAM | About 19.6 GB at most for the whole PC (other programs included, in the runs without power throttling). Within 32 GB |
| Biggest bottleneck | Blender running without a window while Windows Energy saver was on. The same jobs were 5–12x slower |
In short, check Energy saver first before buying parts. Then watch which part fills up in Task Manager, and decide whether to replace just that part.
2. What a bottleneck is
A bottleneck is the narrow part, like the neck of a bottle. When you turn a bottle upside down, how fast the water comes out depends on the narrow neck, not the body. Make the body twice as big and the water still comes out at the same speed if the neck stays the same.
Computers work the same way. To finish one rendered frame, the CPU, GPU, RAM, VRAM, and storage work in turn or together. The part that finishes last sets the total time. That part sits near 100% use, while the other parts wait idle. So finding the part that is full means finding the bottleneck.
What each part does is covered in detail in The difference between a CPU and a GPU, What VRAM means, and How much RAM do you need?. This post focuses on measuring "how busy" each part is.
Memory (RAM and VRAM) is read a little differently. Instead of use, look at how much is left. Memory is like desk space: as long as it is not running out, a bigger desk does not make you faster. From the moment it runs out, things slow down sharply or stop.
3. Two tools for measuring
3-1. Task Manager
It comes with Windows, so there is nothing to install.
Follow along:
- Press
Ctrl+Alt+Delete, then choose Task Manager. - Choose the Performance tab on the left.
- Click CPU, Memory, and GPU 0 (or GPU 1) one at a time to see each graph.
- On the CPU graph, right-click ‣ Change graph to ‣ Logical processors to see a separate graph for each thread. If only one box is full, the job is running on a single core.
The GPU graph has a trap. By default, Task Manager's GPU view shows use of the 3D engine. Cycles rendering and AI models use the compute (Compute, CUDA) engine instead. So even when the graphics card is working hard, the 3D graph can sit near 0%. Click the label of one of the four small graphs on the GPU page (it says 3D, Copy, and so on) and switch it to Cuda or Compute_0.
3-2. nvidia-smi
If you have an NVIDIA graphics card, the driver installs a command-line tool called nvidia-smi. It shows the graphics card's use, memory, power, and temperature as numbers.
Follow along:
- Open Terminal (or Command Prompt) from the Start menu.
- Enter this line and press
Enter.
nvidia-smi --query-gpu=utilization.gpu,memory.used,power.draw,temperature.gpu --format=csv -l 1
- Every second it prints one line: "use %, memory in use MiB, power W, temperature".
- Start a render and watch how the numbers change.
- Press
Ctrl+Cto stop.
This tool shows use without separating 3D and compute, so it does not have Task Manager's trap. All GPU values in this post were logged with this tool every 0.5 seconds.
4. Four test jobs
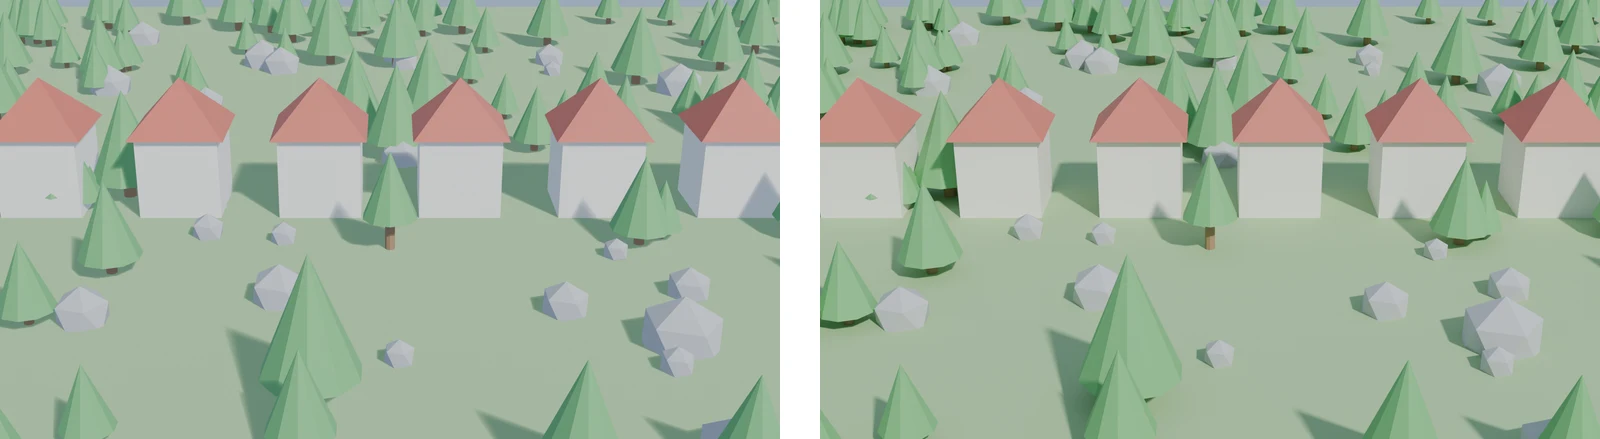
 Figure 1. Results of the test jobs. From left: EEVEE render, Cycles render, cloth simulation (Blender render)
On the same laptop, I picked four jobs with different characters. The scene is the "medium" scene from Blender EEVEE on an 8 GB laptop GPU (six houses, trees, and rocks, 383 objects).
| Job | Settings | Main part used (expected) |
|---|---|---|
| EEVEE render | 1920x1080, 64 samples | GPU |
| Cycles GPU render | 1920x1080, 128 samples, denoising, OptiX | GPU |
| Cycles CPU render | Same settings on the CPU | All CPU cores |
| Cloth simulation | 80x80 cloth falling onto a ball for 60 frames, self-collision on | CPU |
The test setup was:
| Item | Value |
|---|---|
| Laptop | Acer Predator PHN16-72 |
| CPU | Intel Core i9-14900HX (24 cores, 32 threads) |
| GPU | NVIDIA GeForce RTX 4070 Laptop GPU, 8 GB, driver 610.62 |
| RAM | 32 GB (Windows shows 31.7 GB) |
| OS and power | Windows 11 Pro, adapter connected (battery 100%), Balanced power plan, Energy saver on |
| Blender | 5.2.1, run from the command line without a window |
| Other programs | Several other work programs. Whole-PC CPU use was 15–20% before each test |
For renders, I dropped the first frame (it includes setup time), measured 5–10 frames, and used the median. CPU renders take long, so I measured only 2–3 frames, and the cloth simulation is one run of 60 frames.
5. Which part is busy in each job
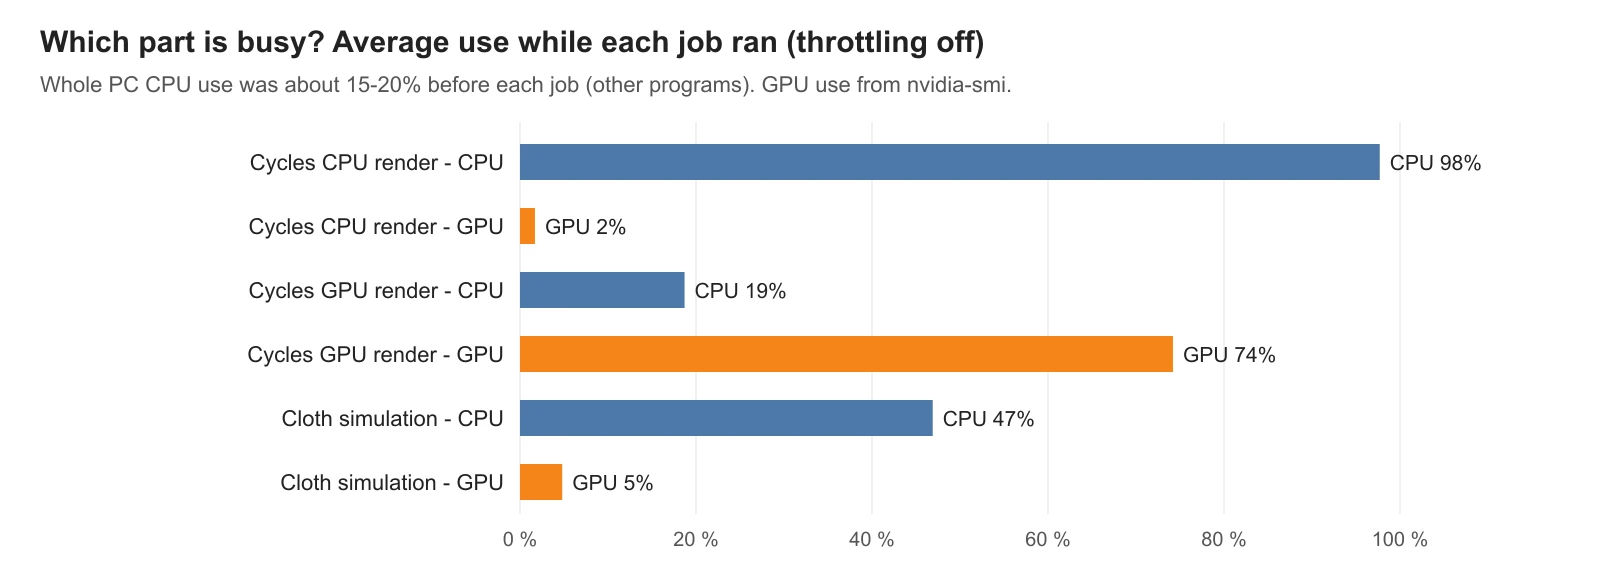 Figure 2. How busy the CPU and GPU were in each job. Average while rendering (chart)
Figure 2 shows average use while each job ran. Each job clearly has a different bottleneck.
Cycles CPU render filled almost all 32 CPU threads (98%). The GPU sat idle at 2%. In jobs like this, the CPU's core count and clock set the time. To speed it up, change the CPU, or better, move the render to the GPU. In fact, rendering the same scene on the GPU cut one frame from 45.6 s to 3.43 s. Switching the device on the same laptop made it 13x faster.
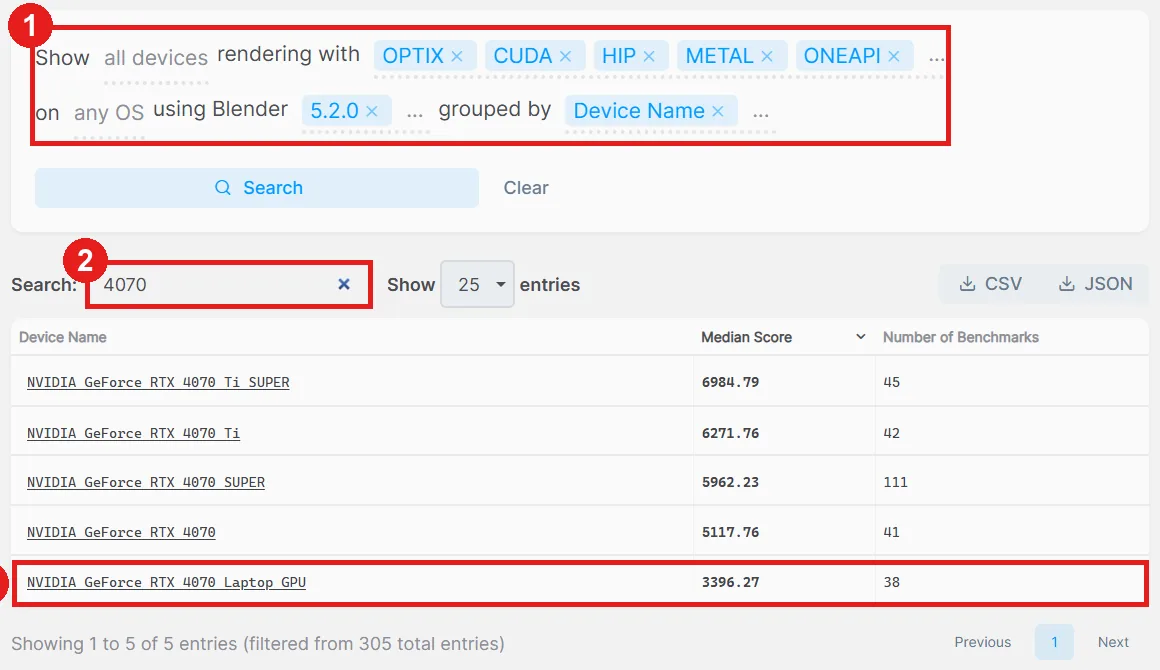
Cycles GPU render pushed the GPU to 74% on average and up to 90%. Graphics card power averaged 63.5 W and peaked at 79.3 W, close to this graphics card's default power limit of 80 W shown by nvidia-smi (the same tool shows a maximum limit of 140 W). The CPU had room at 19%. The bottleneck in this job is the GPU. To go faster, you need a stronger graphics card. You can compare how fast each card is by score in How to read Blender Open Data benchmark results.
Cloth simulation used 47% of the whole PC's CPU on average. Before it started, other programs kept it around 17%, so close to ten of the 32 threads did extra work. The graphics card was at 5%, barely used. This is CPU work, so a new graphics card will not speed it up. The busiest thread was at 87% during the simulation, but it was already at 81% before it, because of other programs, so this value cannot tell whether the work piled up on one thread. How cores and threads relate is in CPU cores and threads.
EEVEE render finished one frame in 0.46 s, so the average from 0.5-second logging was hard to trust. Still, graphics card power rose to 63 W during the render, confirming that the GPU did most of the work. For short jobs, the graphs become clearer if you watch a few-hundred-frame animation instead of one frame.
6. When the bottleneck is a setting, not a part: Energy saver
The first values I measured were much slower than the ones above. A Cycles GPU frame was scattered from 18.8 s to 84.4 s, and the graphics card worked only 22% on average. The CPU render used only 41% of the CPU on a 32-thread laptop. Nothing was full, yet it was slow. That is a sign the bottleneck is outside the parts.
What I suspected was Windows power throttling. My laptop had Energy saver on even with the adapter plugged in, and I ran Blender from the command line without a window. So I used a feature Windows provides to take only the Blender program out of power throttling, and ran the same jobs again. Energy saver itself stayed on.
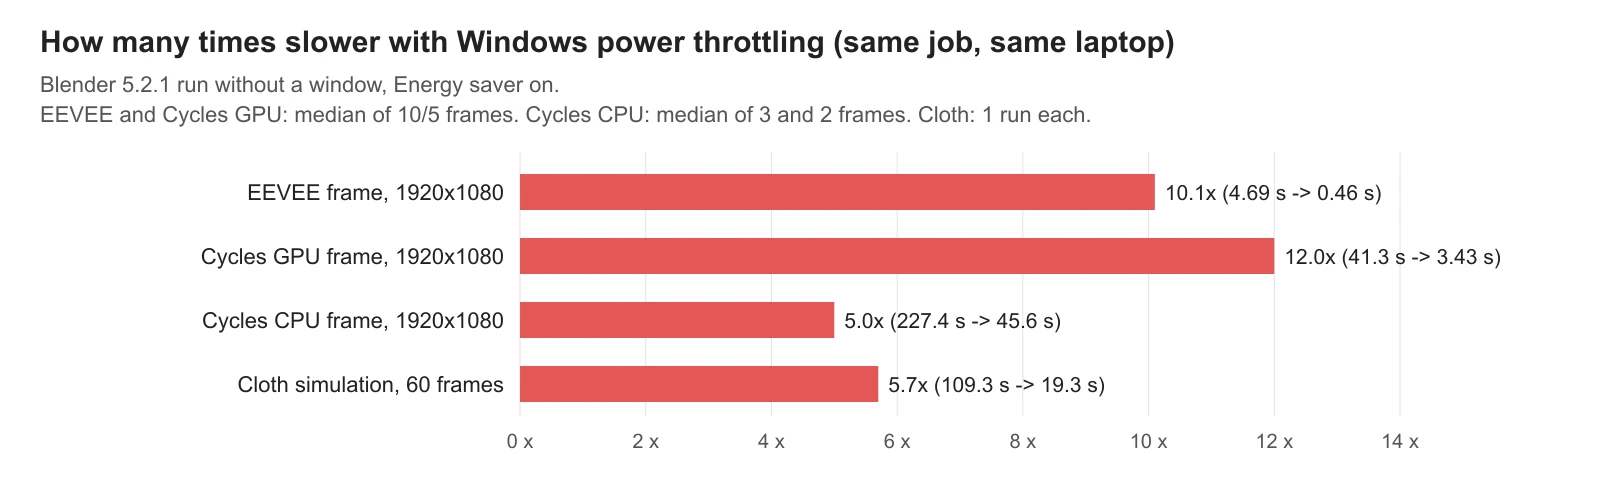 Figure 3. How many times slower the same jobs were with power throttling. Parentheses show the time with → without throttling. EEVEE and Cycles GPU are medians, Cycles CPU is the median of 2–3 frames, cloth is 1 run (chart)
| Job | With power throttling | Without | Difference |
|---|---|---|---|
| EEVEE frame | 4.69 s (1.90–9.75 s) | 0.46 s (0.45–0.53 s) | 10.1x |
| Cycles GPU frame | 41.3 s (18.8–84.4 s) | 3.43 s (3.36–3.48 s) | 12.0x |
| Cycles CPU frame | 260.9 s, 227.4 s, 225.3 s (median 227.4 s) | 45.0 s, 46.1 s (median 45.6 s) | 5.0x |
| Cloth simulation, 60 frames | 109.3 s (1 run) | 19.3 s (1 run) | 5.7x |
Removing only power throttling made the jobs 5–12x faster, so I believe throttling was the cause. Windows gives each program a level (QoS) that says how urgent it is, and for low-level programs it picks the most power-efficient clock and efficient cores (Microsoft's Quality of Service page). That page only describes how programs with a window are classified: in front and in focus is high, visible is medium, minimized or fully covered is low. For programs without a window, it only says other rules decide. The page also describes the low level's power saving as the behavior on battery. So the page cannot tell us which level a windowless Blender got, or why power saving applied with the adapter plugged in. The evidence is the measurement: Energy saver was on, and taking only that program out of throttling made it faster.
Two things stand out. First, the gap is huge, 5–12x. For comparison, by Blender Open Data score the RTX 4090 is about 3.4x the RTX 4070 Laptop GPU (section 4 of Blender render cost). One setting made a bigger difference than that. Second, with power throttling, times scattered widely for the same settings. One frame took 1.9 s, another 9.8 s. Without it, frames came in evenly at 0.45–0.53 s. If your render times jump around, suspect this cause first.
You can also guess why a GPU render slowed down because of a CPU setting. The CPU is what hands work to the graphics card. If the CPU that prepares the scene and sends it to the graphics card runs slowly on efficient cores, the graphics card sits idle waiting for work. That is why GPU use stayed at 22%.
Follow along: Check Energy saver on your laptop.
- Open Start ‣ Settings ‣ System ‣ Power & battery.
- See whether the Energy saver row is on.
- Expand that row and check whether Always use energy saver is on. If it is, Energy saver stays on even with the adapter plugged in.
- When rendering, turn Energy saver off and keep the Blender window in front.
What the settings page looks like and how it relates to power mode, with pictures, is in How laptop energy saver affects render times. My measurements were done with Blender run from the command line without a window. Minimized programs are classified as low level on Microsoft's page, but I did not measure a minimized Blender window. I also did not run the same test with Energy saver turned off. On your PC, turn Energy saver off and run the jobs in the table above again to compare.
7. Memory bottlenecks: room left in RAM and VRAM
Memory was not the bottleneck in this test scene.
| Memory | At most | Total | Room |
|---|---|---|---|
| VRAM (graphics memory) | about 2.5 GB (Cycles GPU render, whole-card use including the screen) | 8 GB | plenty |
| RAM | about 19.6 GB (whole PC, other programs included, in the runs without power throttling; 27.1 GB during the throttled CPU render) | 31.7 GB | plenty |
Here is how to tell if memory is the bottleneck.
- RAM: In Task Manager ‣ Performance ‣ Memory, if "In use" nearly reaches the total and "Committed" is larger than the total, you are short. Windows then starts using storage in place of RAM, and everything slows down a lot.
- VRAM: If memory in use in
nvidia-smireaches the total, you are short. When VRAM runs out, Cycles may stop with an out-of-memory error, or keep part of the data in RAM and run slowly.
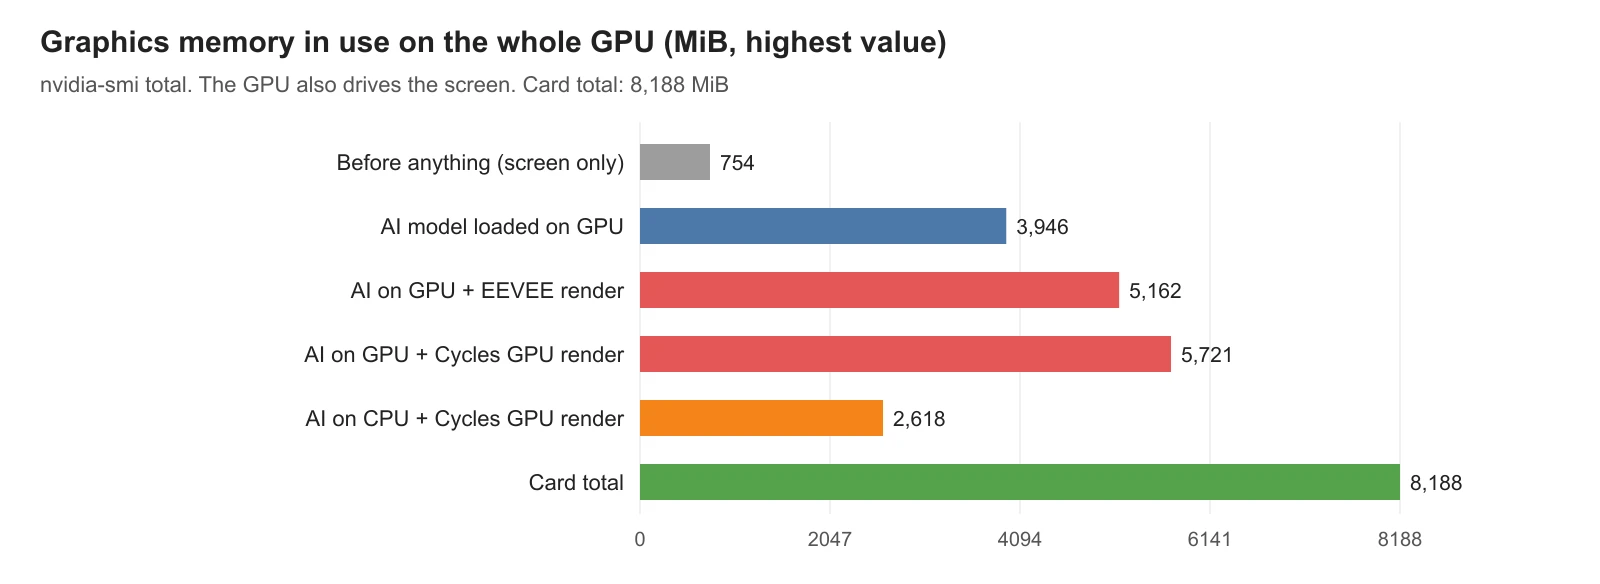
For memory, the test is "has it reached the total", not "100% use". If it is only half full, more memory will not make it faster. Things change when you run a program that takes a lot of VRAM, such as a local AI model, alongside Blender. I measured that case in Running Blender and a local AI on one graphics card.
8. Upgrade order based on the results
Hold your results up against this table. Go from the top. Cheaper steps are higher up.
| Order | If you see this | Do this first |
|---|---|---|
| 1 | Nothing is full but it is slow, and times jump around | Turn Energy saver off, keep the window in front, plug in the adapter. Close other programs |
| 2 | GPU use is high, then suddenly drops, with high temperature | Check heat. See the fixes in Heat and throttling |
| 3 | The CPU is full in a Cycles CPU render | First try switching to GPU rendering (free). If you must use the CPU, a CPU with more cores |
| 4 | The GPU is full in a GPU render | A stronger graphics card. Estimate the speedup in advance with Open Data scores |
| 5 | VRAM reaches the total and errors appear | Slim the scene (texture sizes, turn off hidden objects). If still short, a card with more VRAM |
| 6 | RAM reaches the total | Add RAM. On a laptop, first check the maker's spec sheet to see if RAM can be replaced |
| 7 | In simulations or modifier calculations, only the CPU is busy and the GPU is idle | Look at the CPU side. If only one or two boxes are full in the logical processors graph, a CPU with fast single cores; if many boxes fill evenly, a CPU with more cores (this post's measurement could not tell these apart) |
| 8 | Storage use is full when opening or saving files or loading textures | Move work files to a fast SSD. SSD, HDD, NVMe, and M.2 |
Laptops and desktops differ in which parts you can replace. On a desktop you can replace the graphics card, RAM, and storage separately. On a laptop you usually cannot replace the graphics card or CPU, and many models have RAM soldered to the board. If a laptop hits rows 3, 4, or 7 above, the fix becomes replacing the whole machine, not one part. Another path is to send only the heavy renders out. The cost calculation is in Blender render cost: comparing your PC, cloud GPUs, and render farms. Differences between laptops and desktops are in Laptop vs desktop for Blender and 3D work.
9. Comparing with the official recommended specs
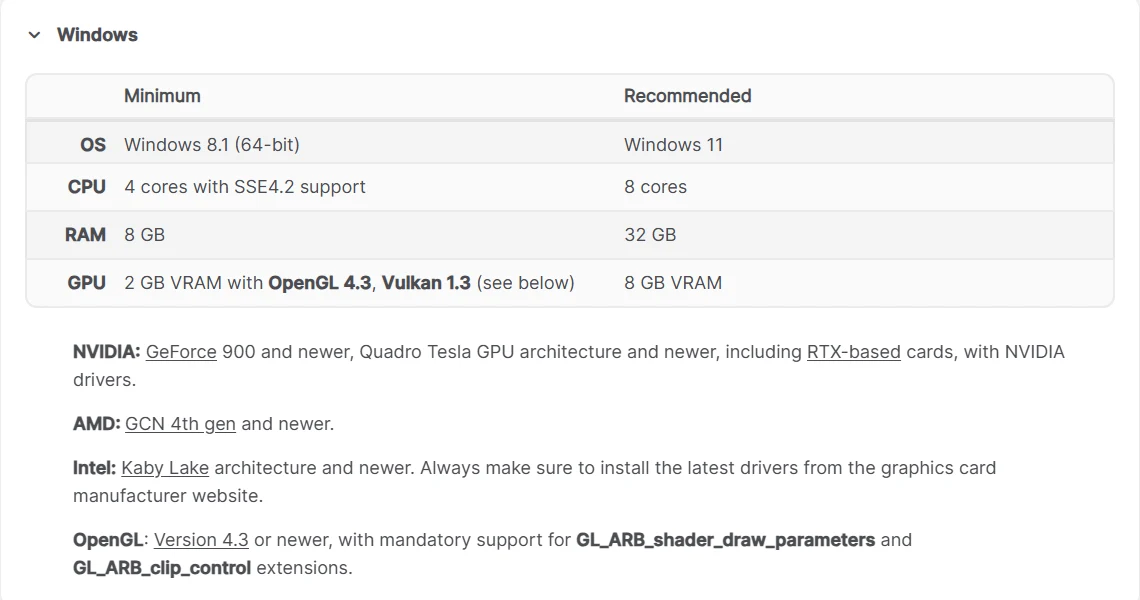 Figure 4. The Windows table from Blender's official requirements. Minimum on the left, recommended on the right (blender.org screenshot)
On Windows, Blender's minimum is 8 GB RAM and 2 GB VRAM, and the recommended spec is an 8-core CPU, 32 GB RAM, and 8 GB VRAM (Figure 4). The laptop in this post sits right at the recommended level. Even so, the test scene left plenty of memory, and the bottleneck was the CPU or GPU depending on the job.
Recommended specs are a reference point for "most work will be comfortable at this level." Which part your own work fills up, you only learn by measuring. Use measured in your own work is a better basis for an upgrade than numbers on a spec sheet. Choosing specs by use is covered in Computer specs for AI, Blender, and game engines.
Practice
- With Task Manager's Performance tab open, render one frame in Blender with
F12. Write down whether the CPU or GPU graph rises more. - Change the GPU graph label from 3D to Cuda (or Compute_0), and render the same frame again. Check how the two graphs differ.
- Switch the render engine to Cycles, change Device in the Render tab between CPU and GPU Compute, and measure the render time of the same scene. Write down how many times different they are.
- In Settings ‣ System ‣ Power & battery, check whether Energy saver is on. If it is, turn it off and measure the time from step 3 again.
- Pick which row of the table in section 8 matches your results. Also write down whether that row's "Do this first" costs money.
Common mistakes and fixes
| Symptom | Cause | Fix |
|---|---|---|
| Task Manager shows GPU at 0% during a Cycles render | Task Manager shows only the 3D engine | Switch the graph label to Cuda or Compute_0, or use nvidia-smi |
| Render times vary several times over with the same settings | Energy saver and power throttling, other programs running | Turn Energy saver off, keep the window in front, close other programs and measure again |
| CPU use is around 20% but the simulation is slow | Only one thread is busy | Switch to the logical processors graph and see if only one box is full. Single-core speed is the bottleneck |
| You replaced the graphics card but the simulation is the same | Simulation is CPU work | Measure the job's GPU use before replacing anything |
| You added RAM but nothing got faster | RAM was not running short | Judge memory by whether it reaches the total, not by use |
| Only the first frame takes unusually long | Shader preparation and scene setup | Ignore the first frame and measure from the second |
Summary
Before buying parts, turn Energy saver off, find the part that fills up with Task Manager and nvidia-smi, and replace only that part.
References
- Blender requirements: https://www.blender.org/download/requirements/
- Blender manual, GPU rendering: https://docs.blender.org/manual/en/5.2/render/cycles/gpu_rendering.html
- Microsoft Learn, Quality of Service (QoS levels and power throttling): https://learn.microsoft.com/en-us/windows/win32/procthread/quality-of-service
- NVIDIA, nvidia-smi documentation: https://docs.nvidia.com/deploy/nvidia-smi/index.html
- Images: renders were made for this post with Blender 5.2.1; the requirements table is a blender.org screenshot; charts are drawn from values measured on my PC.