Running Blender and a local AI on one graphics card: measured VRAM sharing on 8 GB
On my laptop with an RTX 4070 Laptop GPU (8 GB), I kept a local AI model (Gemma 4 E4B on llama.cpp) running while rendering with Blender EEVEE and Cycles. I measured how full the graphics memory got, how much the render and the AI slowed each other down, and whether to put the AI on the graphics card or the CPU. The post ends with steps to plan memory on your own PC.
한국어English
ON THIS PAGE
- 011. The short answer
- 022. Two people sharing one workbench
- 033. Test setup and method
- 044. How full does graphics memory get
- 055. How much slower does the Blender render get
- 066. How much slower does the AI get
- 077. Put the AI on the graphics card or the CPU
- 088. Plan memory on your own PC
- 099. Choosing a VRAM size
- 1010. The order of work when using both
- 11Practice
- 12Common mistakes and fixes
- 13Summary
- 14References
Based on: Blender 5.2 LTS (measured with 5.2.1), llama.cpp (build 11870, Vulkan), the Gemma 4 E4B model (Q4_K_M), and an NVIDIA GeForce RTX 4070 Laptop GPU with 8 GB (driver 610.62). Measured on my PC on November 4, 2026. The screenshot is a real capture of the llama.cpp web page. Charts are drawn from the measured values.
You have one graphics card. Can Blender and a local AI stay open at the same time? This comes up often when you let an AI drive Blender, for example through Blender MCP. The AI model runs on your own computer, and Blender renders on the same graphics card. The two programs have to share graphics memory (VRAM) and compute.
So I measured it. On my laptop with 8 GB of graphics memory, I kept a local AI model running while rendering in Blender. I logged how full the memory got, how much the render and the AI slowed each other down, and what changed when the AI ran on the graphics card versus the CPU. The basics of running AI locally are in Running AI on your own computer, and connecting a local AI to Blender is in Driving Blender with AI on your own computer. This post gives the numbers for running both on the same graphics card at the same time, and the steps to plan memory on your own PC.
1. The short answer
| Question | What I measured on my PC |
|---|---|
| Load the AI model onto the graphics card | VRAM use went from 754 MiB to 3,946 MiB (about 3.1 GB more) |
| Add a Cycles GPU render on top | Peak 5,721 MiB. Fits in 8 GB (8,188 MiB) |
| AI loaded but idle | Render time almost unchanged (EEVEE frame 0.46 s → 0.47 s) |
| Render while the AI is writing | EEVEE 1.9x slower, Cycles 2.9x slower |
| AI speed during a render | 63.5 tokens/s → 47.2 during EEVEE, 33.3 during Cycles |
| AI on the CPU only | Almost no VRAM. But the AI drops to about 8 tokens/s, and while the AI is writing, renders are still 1.5–1.6x slower |
In short, a small AI model (Gemma 4 E4B) and a Blender scene of this size fit together in 8 GB. But when both work at once, they take compute from each other and both slow down. Working at the same time was a bigger problem than memory.
2. Two people sharing one workbench
Graphics memory is a workbench right next to the graphics card. Only what sits on the bench can be handled quickly. More detail is in What VRAM means.
Running Blender and a local AI together is like two people sharing one workbench. Two things collide.
- Space: The bench has a fixed size. If the AI model takes a lot of space, there is less room for the Blender scene. If space runs out, the render stops or fails.
- Hands: There is also only one pair of hands at the bench (the graphics card's compute units). While one person works, the other waits. So when both work at once, both slow down.
If the AI model only sits on the bench, it takes space but does not use the hands. You can see this difference clearly in the results below.
3. Test setup and method
| Item | Value |
|---|---|
| Laptop | Acer Predator PHN16-72, i9-14900HX (24 cores, 32 threads), 32 GB RAM |
| Graphics card | NVIDIA GeForce RTX 4070 Laptop GPU, 8 GB (8,188 MiB), driver 610.62. Also drives the screen |
| AI program | llama.cpp llama-server (build 11870, Vulkan build) |
| AI model | Gemma 4 E4B, Q4_K_M quantized file (about 5 GB). Context limit 8,192 tokens |
| AI workload | The same question, answered in up to 256 tokens, repeated without a break |
| Blender | 5.2.1, a 383-object scene, 1920x1080. EEVEE 64 samples, Cycles 128 samples (OptiX, denoising) |
| Logging | nvidia-smi every 0.5 s for VRAM, use, and power. Renders: first frame dropped, median of 10 EEVEE or 5 Cycles frames |
I loaded the model two ways. Giving llama-server an -ngl value (number of layers to put on the graphics card) of 99 puts the whole model on the card. A value of 0 keeps it off the card and runs it on the CPU.
On test day this laptop had Windows Energy saver turned on. On my PC, programs running without a window slowed down a lot with Energy saver on. So I took both Blender and the AI server out of Windows power throttling before measuring. That effect is covered separately in Finding the bottleneck in your computer. A few other programs were also running, and whole-PC CPU use was 15–20% before each test.
4. How full does graphics memory get
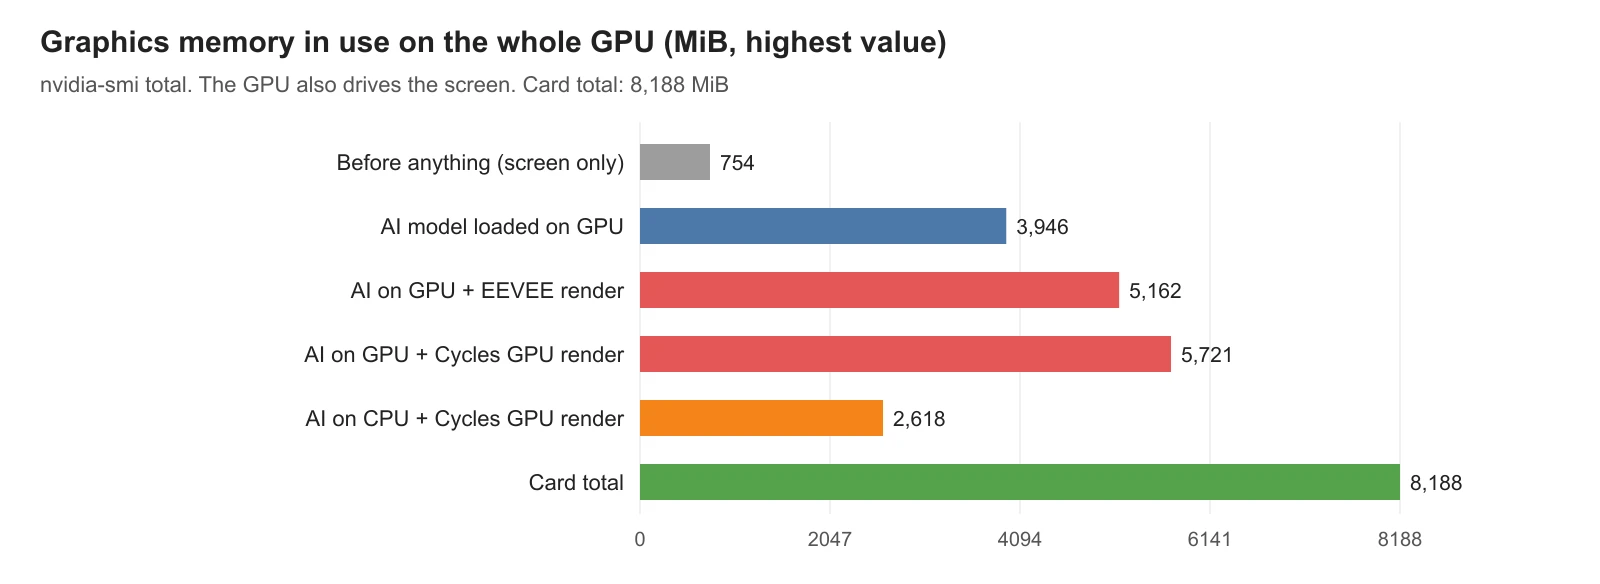 Figure 1. Graphics memory use in each situation. Values are the highest total use on the card (chart)
Read Figure 1 from the top.
- With nothing running, 754 MiB is already in use. That is the share for drawing the screen. On a laptop you need to plan without it.
- Loading the AI model onto the card raised it to 3,946 MiB. The model and its conversation memory took about 3.1 GB.
- Rendering in that state went up to 5,162 MiB with EEVEE and 5,721 MiB with Cycles GPU. About 2.4 GB of the card's 8,188 MiB was left.
- With the AI on the CPU only, a Cycles render used 2,618 MiB. That is about the same as Blender alone.
The model file was about 5 GB, but graphics memory grew by less than that. Do not decide "it won't fit" from file size alone. It is more accurate to load it and measure how much memory grows. On the other hand, a larger context limit (-c) makes the conversation memory bigger and uses more VRAM. This post only measured 8,192 tokens.
One thing to know when reading the values. If you just run nvidia-smi on a Windows laptop, the process list at the bottom shows Blender and the AI server, but the memory column for each program says "N/A". Because of how Windows manages graphics memory, it does not show per-program values. So this post counted each program's share by how the whole card's use changed: turn one thing on and measure how much it grew. You can also get a rough per-program value in Task Manager: on the Details tab, right-click a column header and add the "Dedicated GPU memory" column.
The test scene has 383 objects and no textures, so it is small. Scenes with many textures, 4K renders, or hundreds of thousands of objects need a bigger Blender share. Then the remaining 2.4 GB may not be enough.
5. How much slower does the Blender render get
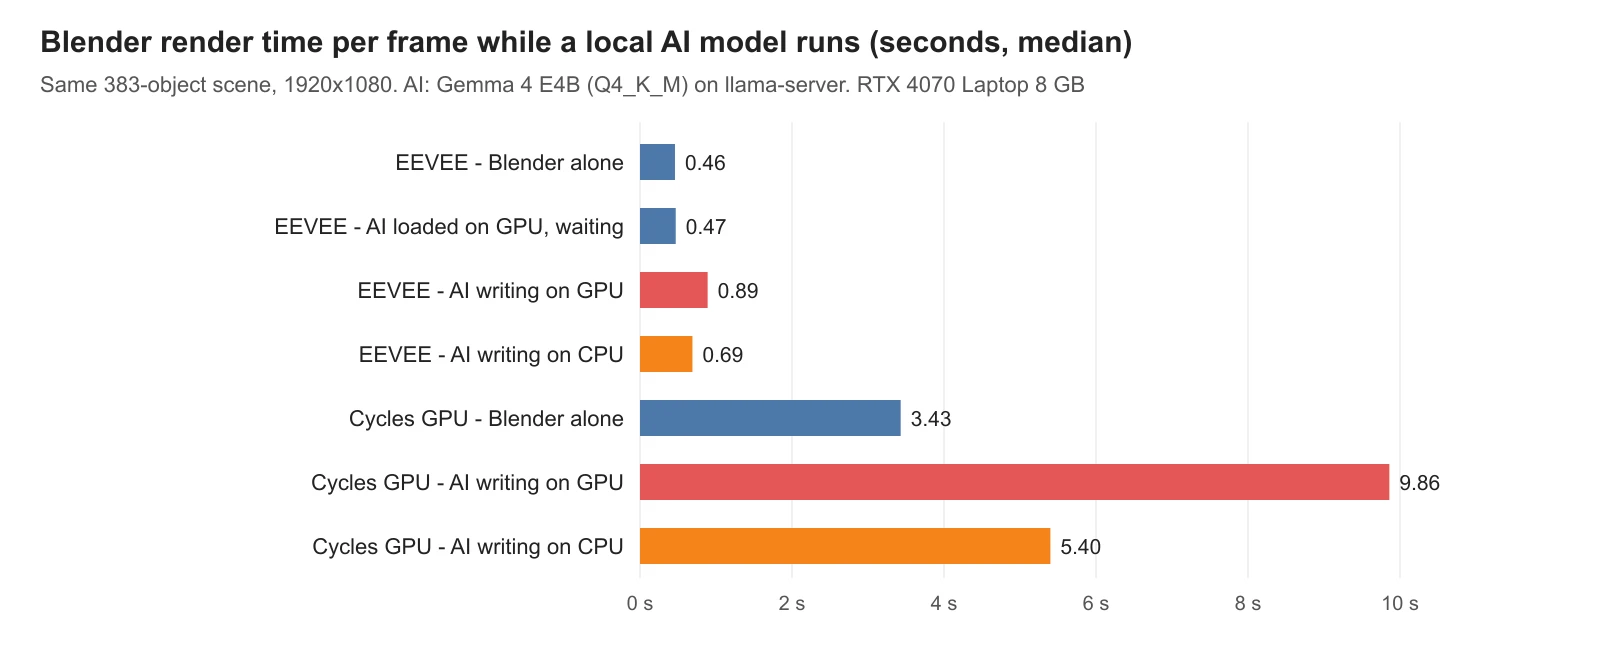 Figure 2. Blender render time per frame by AI state. Median (chart)
| Situation | EEVEE frame | Cycles GPU frame |
|---|---|---|
| Blender alone | 0.46 s | 3.43 s |
| AI on the graphics card, idle | 0.47 s | not measured |
| AI writing on the graphics card | 0.89 s (1.9x) | 9.86 s (2.9x) |
| AI writing on the CPU | 0.69 s (1.5x) | 5.40 s (1.6x) |
With the AI only loaded, render time barely changed. It takes space but not hands. So as long as the memory fits, you can keep the AI open while you use Blender.
Once the AI starts writing, things change. The two programs share the compute units, and Cycles became almost 3x slower. Cycles slowed down more than EEVEE, most likely because Cycles keeps the graphics card's compute units busy for longer and more fully.
Keeping the AI on the CPU still made renders 1.5–1.6x slower. The graphics card was free, but the AI took many CPU threads. The CPU is also what feeds work to the graphics card, so when the CPU is busy, the GPU render waits too.
6. How much slower does the AI get
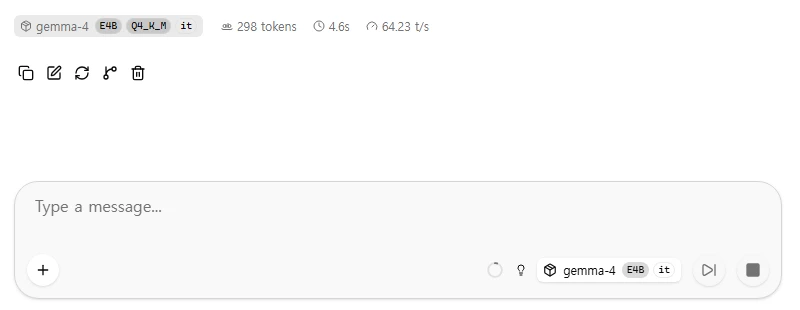 Figure 3. The speed shown on the llama.cpp web page after one answer. 298 tokens in 4.6 seconds, or 64.23 tokens per second (llama.cpp web page screenshot)
AI speed is measured in tokens per second (tok/s). A token is the unit the AI writes in, about one English word or part of a word. When you get an answer on the llama.cpp web page, the token count, time, and tokens per second appear under the answer, as in Figure 3.
Follow along: Check the speed on your PC.
- Start
llama-serverand openhttp://127.0.0.1:8080in a web browser (how to start it is in section 5 of Driving Blender with AI on your own computer). - Type a question in the box at the bottom and press
Enter. - When the answer ends, write down the
t/snumber under it. - Start a render in Blender, send the same question again, and compare the numbers.
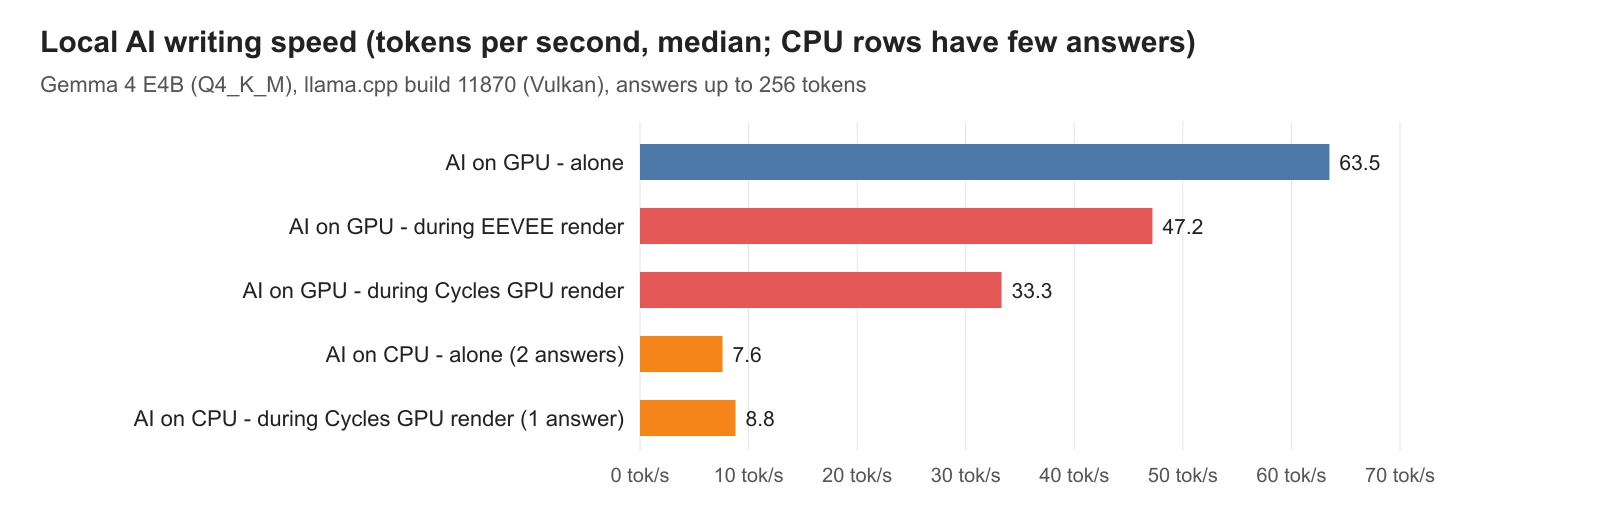 Figure 4. AI writing speed in each situation. Median; the CPU bars come from few answers (the bottom bar is 1 answer) (chart)
| Situation | Tokens per second |
|---|---|
| On the graphics card, alone | 63.5 |
| On the graphics card, during an EEVEE render | 47.2 (3 answers) |
| On the graphics card, during a Cycles GPU render | 33.3 (9 answers, 29.5–41.9) |
| On the CPU, alone | 7.6 (2 answers) |
| On the CPU, during renders | 8.4–12.7 (8 answers) |
On the graphics card, the AI wrote 63.5 tokens per second when alone. Overlapping with a render cut that nearly in half. On the CPU it wrote about 8 tokens per second even alone, about 1/8 of the graphics card speed. But overlapping with a GPU render barely changed it. The CPU numbers moved between 7 and 13 depending on answer length, and I measured only a few, so treat them as rough values.
Turning the numbers into waiting time makes the gap clearer. For the same question, one answer usually took 3–4 seconds on the graphics card and 21–33 seconds on the CPU. Over a few rounds of conversation, this adds up. If you give an AI a multi-step job through Blender MCP, you wait this long at every step.
Reading the question (the step before writing, where the model reads the whole prompt) was also very different. About 373 tokens per second on the graphics card, about 22 on the CPU. In jobs that send long scene information to the AI, as Blender MCP does, you feel this gap even more. The CPU can take tens of seconds just to read one long prompt.
7. Put the AI on the graphics card or the CPU
On the graphics card (-ngl 99) | On the CPU (-ngl 0) | |
|---|---|---|
| VRAM | about 3.1 GB more | almost none |
| AI speed | fast (63.5 tokens/s) | slow (about 8 tokens/s) |
| Reading the prompt | fast (about 373 tokens/s) | slow (about 22 tokens/s) |
| Blender while the AI writes | 1.9–2.9x slower | 1.5–1.6x slower |
| Good for | when memory is left over and you alternate AI and renders | when a big scene leaves little VRAM |
In my measurements, putting the AI on the graphics card is usually better. The AI is 8x faster, and while the AI is idle there was almost no cost to the render. If you take turns, asking the AI first and starting the render after the answer ends, both programs run at full speed.
Keeping it on the CPU is a fallback for when the Blender scene is big and VRAM runs short. You can also give -ngl a value between 99 and 0 to put only part of the model on the card. I did not measure those in-between values this time. Also, if you leave out -ngl entirely, the default is auto (llama.cpp server guide). The program then decides how many layers to load by itself, so it is hard to know how much of the model ended up on the graphics card versus the CPU. If you plan to use it with Blender, give the number yourself and check how much memory grew with nvidia-smi. That makes planning easier. Results from putting part of a bigger model on the card are in the measurement section of Driving Blender with AI on your own computer.
8. Plan memory on your own PC
Numbers from your own PC are more accurate than anyone else's. Use these steps to make a plan.
Starting point: Start with both Blender and the AI server closed.
Follow along:
- Open a terminal and run this line to see VRAM every second.
nvidia-smi --query-gpu=memory.used,memory.total,utilization.gpu --format=csv -l 1
- Write down
memory.usedwith nothing running. That is the screen share (754 MiB on my PC). - Load the model you want to use with
llama-serverand write down how much memory grew. That is the AI share (about 3.1 GB on my PC). - Close the AI, render a scene you normally work on in Blender, and write down the highest value. Subtract the screen share to get the Blender share.
- Add screen share + AI share + Blender share and compare with the card total (
memory.total). - If the sum is close to the total, lower the context limit (
-c), use a smaller quantized file, or move the AI to the CPU.
Even if the sum is below the total, leave some room. Browsers, video playback, and other 3D programs also use graphics memory. The Blender share also changes when the scene changes.
9. Choosing a VRAM size
If you are choosing a new graphics card or laptop, use the plan above in reverse. Add the AI share for the model you want and the Blender share for your usual scenes, then add the screen share and some room. Pick a card with more VRAM than that sum.
- 8 GB: As in this post, a small model (about 4.5 billion effective parameters, about 8 billion including embeddings, 4-bit quantized) and a medium scene fit together. Bigger models have to keep part of themselves in RAM, and they get slower for it.
- Cards larger than 8 GB: You get room to load a bigger model fully, or to load a big scene and the AI together. The official tables in Running AI on your own computer help estimate the memory each model size needs.
Even with more VRAM, there is still only one set of compute units. If both work at once, they slow each other down, no matter how much memory is free. If you need both to run for long stretches at the same time, splitting them across devices (for example, the AI on another PC or in the cloud) can help more than adding memory. The cost of sending renders out is in Blender render cost. Choosing a graphics card in general is in Computer specs for AI, Blender, and game engines.
I did not measure image-generating AI models this time. They use memory differently from text models, so measuring them the same way on your own PC is the most accurate.
10. The order of work when using both
Here are the measurements turned into a working order. The example is the flow where a local AI builds a scene through Blender MCP and you render the result.
| Step | What you do | What happens on the graphics card |
|---|---|---|
| 1 | Start the AI server and load the model | The AI share settles into VRAM. Almost no compute |
| 2 | Open Blender and work in Solid or Material Preview view | Light work for drawing the screen. Barely slower with the AI loaded |
| 3 | Send the AI a question to change the scene | The AI uses the compute units. Do not start a render now |
| 4 | After the answer ends, press F12 for a test render | Blender uses the compute units. The AI is idle |
| 5 | Look at the result and repeat steps 3–4 | Taking turns lets each run at full speed |
| 6 | Close the AI server before the final long render (animation) | The AI's VRAM share is freed, leaving room for a big scene |
The key is not to overlap the AI's writing time with render time. In the test, renders while the AI was idle were almost the same as alone (0.46 s and 0.47 s). When they overlapped, a Cycles frame went from 3.43 s to 9.86 s.
Before jobs that use the graphics card for hours, such as a long animation render, it is better to close the AI server. Starting the AI again means reading the model again. On my PC, reading a model stored on an external SSD took about 2 minutes. Keeping the model file on a fast internal SSD shortens this.
The AI server also often runs without a window. If Energy saver is on, the AI server can slow down too. On my PC, before removing power throttling, the web page sat at "Processing 0%" for more than 25 seconds after I sent a question. After removing it and sending the same question, the answer came back, and it wrote at 64 tokens per second as in Figure 3. If renders or the AI are slow for no clear reason, check Energy saver first.
Practice
- With
nvidia-smi, write down VRAM use with nothing running. That is your PC's screen share. - Load a local AI model and write down how much VRAM grew. Compare it with the model file size.
- Render the same scene with
F12while the AI is idle and while it is writing, and compare the Time value in the render window. - Restart
llama-serverwith-ngl 0and write down what fraction of the-ngl 99speed thet/svalue is. - Follow section 8 to add screen share + AI share + Blender share and compare with the card total. Write down how much is left.
Common mistakes and fixes
| Symptom | Cause | Fix |
|---|---|---|
| Cycles gives an out-of-memory error after you started the AI | AI share + Blender share is more than the card total | Measure each share with nvidia-smi, then lower -c or move the AI to the CPU |
| The render is slow even though the AI is only loaded | The AI is handling another request, or another program is using the card | Check the AI server log for a request in progress |
| AI answers come at half speed during a render | The compute units are shared | Normal. Change the order so the AI works after the render ends |
| Renders are still slow after moving the AI to the CPU | The AI holds CPU threads, so render setup is late | Render while the AI is idle, or lower the AI server's thread count |
| An AI server or Blender run without a window is unusually slow | Windows Energy saver power throttling | Turn Energy saver off and measure again. Section 6 of Finding the bottleneck in your computer |
| You assumed the model would not fit from its file size | File size and the real VRAM share differ | Load it and measure how much memory grows |
Summary
A small AI model and Blender fit together in 8 GB, but there is only one set of compute units: measure memory to split it, and let them take turns.
References
- llama.cpp server guide (options
-ngl,-c): https://github.com/ggml-org/llama.cpp/blob/master/tools/server/README.md - Gemma 4 E4B GGUF (model card, license Apache-2.0): https://huggingface.co/unsloth/gemma-4-E4B-it-GGUF
- Blender manual, GPU rendering: https://docs.blender.org/manual/en/5.2/render/cycles/gpu_rendering.html
- NVIDIA, nvidia-smi documentation: https://docs.nvidia.com/deploy/nvidia-smi/index.html
- Images: the web page is a screenshot of llama.cpp on my PC; charts are drawn from values measured on my PC.